
Fig. 6.
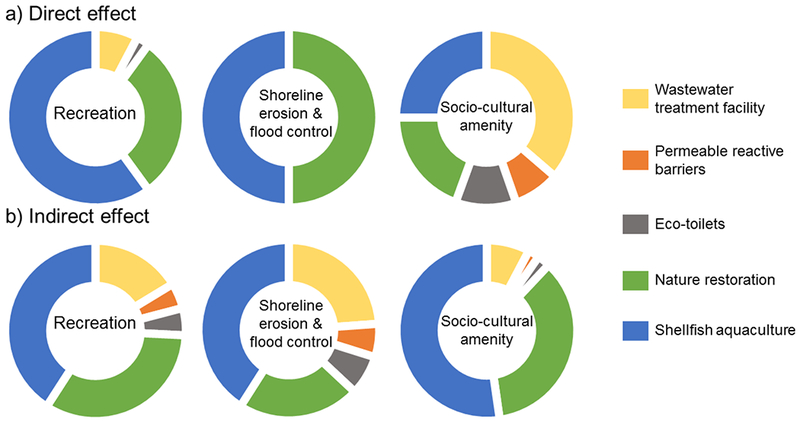
The relative effect from nitrogen management strategy response indicators on the ecosystem service impact indicators: (a) direct response-impact relationships, (b) indirect response-impact relationships. Proportion of pie chart is equivalent to relative interaction effect.