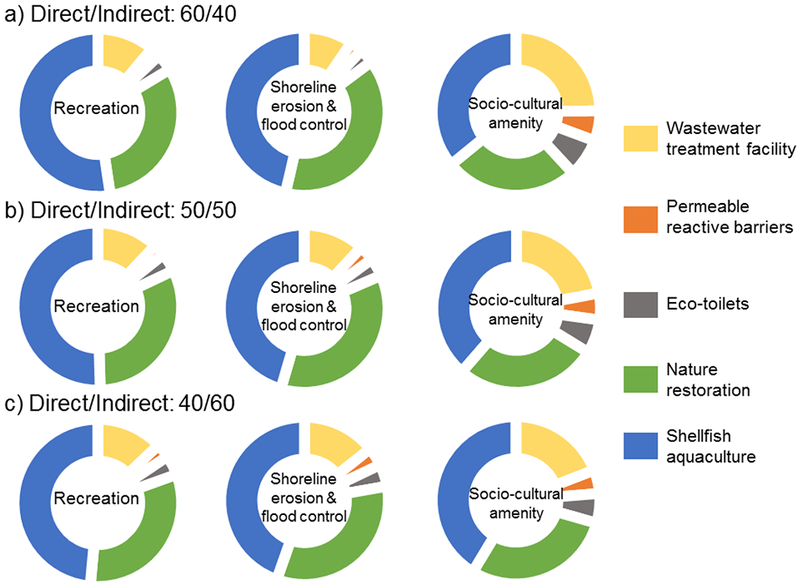
Fig. 7.

Combined response-impact interaction effects based on sensitivity iterations that distributed the relative weight of impact between direct and indirect effects; direct:indirect weight ratios are shown. Proportion of pie chart is equivalent to relative interaction effect.
