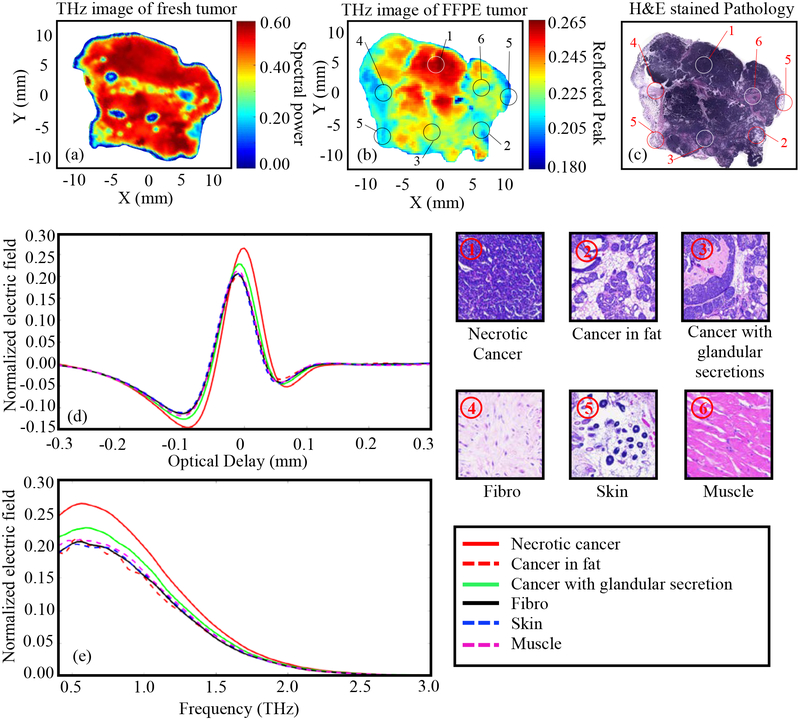
Fig. 7.
THz reflection images of transgenic mice breast tumor 5 (15-B), (a) Frequency domain THz image of freshly excised tumor represented by spectral power, (b) Time domain THz image of FFPE tissue block represented by peak value, (c) Low power pathology image (d) Time domain signals of normalized reflected electric field at selected pixels ①-⑥, (e) Spectrum of normalized reflected electric field of the signals shown in (d). The high power pathology images of surrounding regions of ①-⑥ are shown. All THz signals are normalized with respect to a reference signal reflected from a gold mirror.

