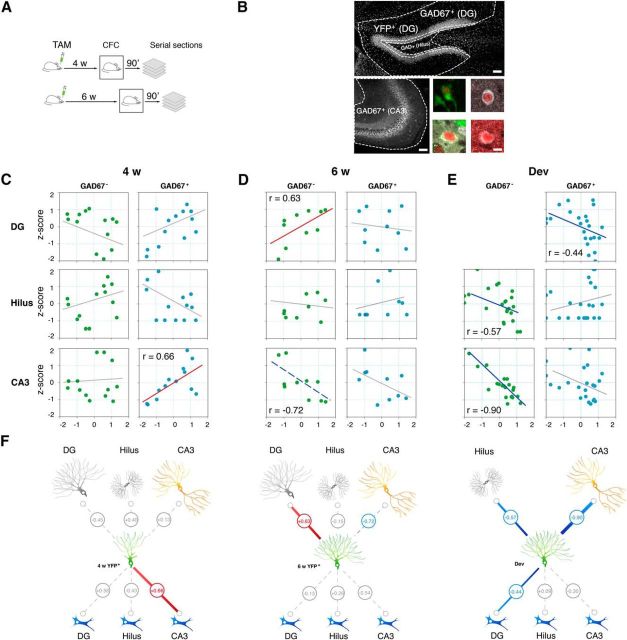
Figure 7.
Correlated Fos expression in adult-generated DGCs and inhibitory interneurons in CA3 after learning. A, nestin–creERT2 × RosaYFP mice received 5 d of TAM injections to induce expression of the reporter YFP in newly born neurons and were trained in contextual fear conditioning 4 or 6 weeks later. Ninety minutes after training, brains were removed and Fos immunohistochemistry was conducted. B, Fos expression was measured in seven distinct hippocampal cell populations (adult-generated DGCs and inhibitory and excitatory cells in DG, hilus, and CA3). Scale bar, 100 μm. Adult-generated DGCs were defined as YFP+. Inhibitory cells were defined as GAD67+ and excitatory cells as GAD67−. Examples of DG–YFP+, DG–GAD67+, hilus–GAD67+, and CA3–GAD67+ cells are shown in the four bottom right panels. Scale bar, 10 μm. C, Scatter plots showing Fos expression in 4-week-old adult-generated DGCs versus excitatory and inhibitory cell populations in DG, hilus, and CA3. Fos expression in 4-week-old adult-generated DGCs was correlated with Fos expression in GAD67+ cells in the CA3. Fos in cell subpopulations is normalized with respect to total hippocampal Fos for each mouse and expressed as a z-score. D, Scatter plots showing Fos expression in 6-week-old adult-generated DGCs versus excitatory and inhibitory cell populations in DG, hilus, and CA3. Fos expression in 6-week-old adult-generated DGCs was correlated with Fos expression in GAD67− cells in the DG and anticorrelated with Fos expression in GAD67− cells in the CA3 (although this correlation does not remain significant after permutation testing). E, Scatter plots showing Fos expression in developmentally generated DGCs (i.e., GAD67− cells in DG) versus excitatory and inhibitory cell populations in DG, hilus, and CA3. Fos expression in developmentally generated DGCs was anticorrelated correlated with Fos expression in GAD67+ cells in DG and GAD67− cells in hilus and CA3. F, Summaries of functional connections (inferred from correlated patterns of Fos expression across mice) for 4-week-old (4w YFP+) and 6-week-old (6w YFP+) adult-generated DGCs and for developmentally generated DGCs (Dev). Significant positive correlations are shown in red. Significant negative correlations are shown in blue. The dashed blue line indicates a negative correlation that did not survive permutation testing. Nonsignificant correlations are shown in gray.

