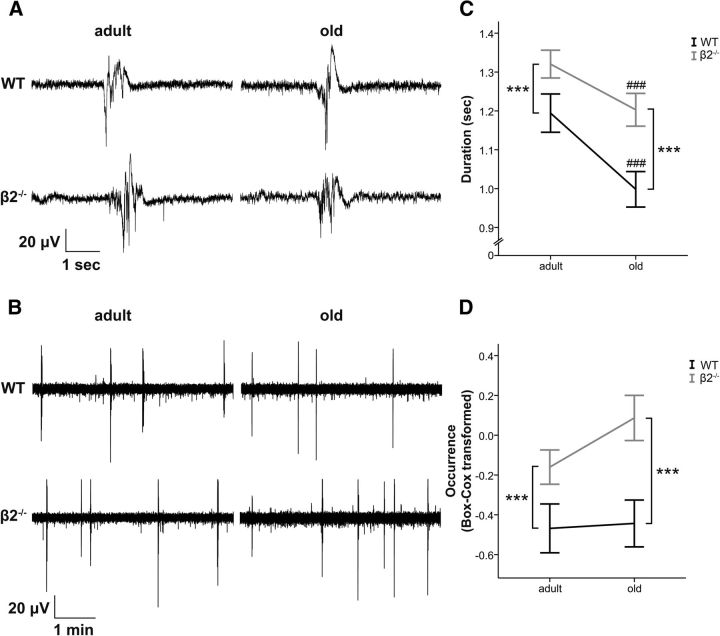
Figure 2.
Up state activity is enhanced in β2−/− mice. A, B, LFP traces (at higher and lower temporal resolution, respectively) obtained from adult (left) and old (right) animals of both genotypes. C, D, β2−/− mice (gray lines) exhibit increased Up state duration and occurrence (Box–Cox transformed for normality) compared with age-matched WT mice (black lines). Graphs show mean ± SEM. Asterisk indicates genotype differences, while # indicates age differences (two-way ANOVA, ***p < 0.001 or ###p < 0.001).

