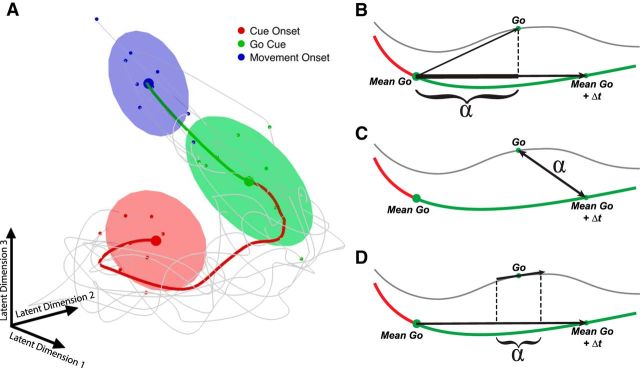
Figure 3.
Neural data and RT prediction methods visualized as low-dimensional trajectories. A, Neural data of both areas of an exemplar condition reduced to a low-dimensional representation of the trial course (determined by GPFA). Thick trace represents the mean of trials for one condition (instructed precision grip, dataset Z120829). Thin gray traces represent 10 random single trials. Shaded ellipses (90% confidence) represent the state of all selected single trials at the start of each epoch. B–D, High-dimensional RT prediction methods in a two-dimensional illustration. Thick red and green traces represents the mean of trials. Thin gray trace represents a single exemplar trial. α denotes the component used to predict RT for the projection method (B), Euclidean distance method (C), and velocity projection method (D).

