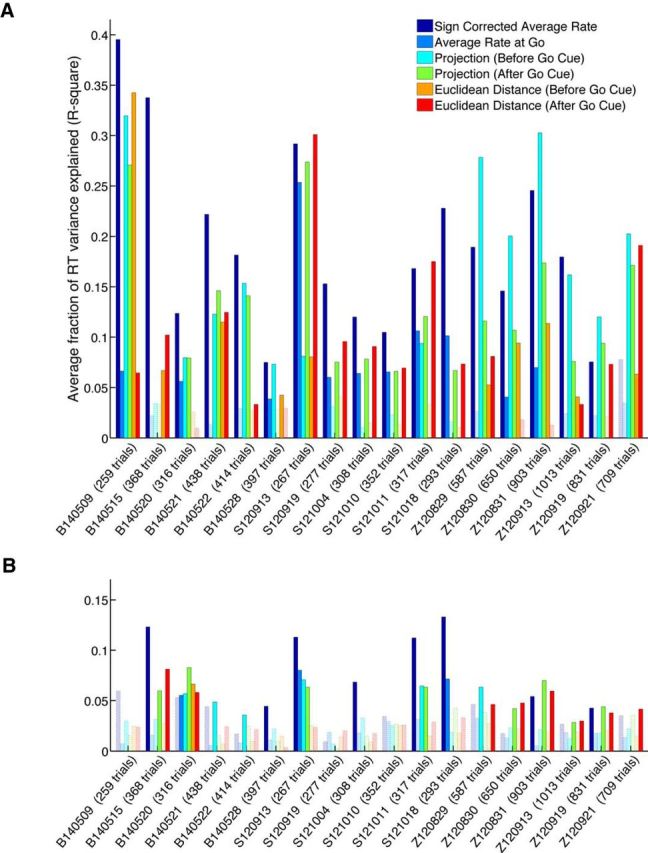
Figure 5.

Average fraction of RT variance explained for all methods and datasets (averaged across conditions and cross-validation folds). A, Average fraction explained by F5 data. B, Average fraction for AIP. Note the clear advantage of area F5 over AIP. Chance-level calculation is based on shuffling neural data with respect to RTs repeatedly. The observed R2 values are then compared against the shuffled distributions to assess significance. Significant results are illustrated as solid bars, whereas the open bars show results that can be explained by chance (p ≥ 0.01).
