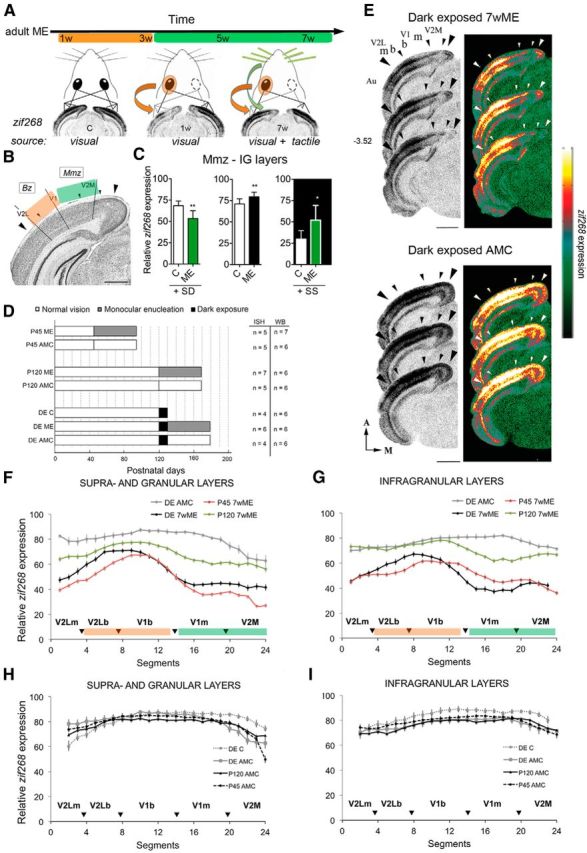
Figure 1.

DE before ME in adulthood induces an adolescent P45-like visual cortex reactivation pattern after 7 weeks of ME. A, Schematic representation of the early open eye potentiation phase (orange; weeks 1–3) and the late cross-modal phase (green; weeks 3–7) of cortical plasticity in response to ME as measured by cortical region- and time-specific zif268 expression (based on the study by Van Brussel et al., 2011). The visual/tactile origin of zif268 induction is indicated below the pictograms and ISH autoradiograms for control, 1 week (1w) ME, and 7 week (7w) ME mice. B, Nissl-stained coronal section of the mouse visual cortex. Scale bar, 1 mm. Large arrowheads demarcate the mediolateral extent of the visual cortex; small arrowheads indicate interareal boundaries. The functional subdivisions of interest: Mmz and Bz are depicted in green and orange, respectively, consistent with the dominant type of plasticity and input source after long-term ME. C, Whisker trimming and stimulation (green) in 7wME mice as proof of the tactile origin of zif268 induction in the Mmz after long-term ME. Quantitative data from the infragranular layers are shown as examples. SD by trimming the right-side vibrissae decreases neuronal activity, whereas SS via exposure to toys and novel objects in the dark increases relative zif268 expression (adapted from Van Brussel et al., 2011). D, Schematic representation of the experimental setup used in this study. Three groups representing adolescence (P45), adulthood (P120), and an additional group subjected to 10 d of total darkness starting at P120 and before ME (DE; black bars) were analyzed and compared. Different subgroups included the following: (1) a 7wME group (gray bars) with the right eye enucleated; (2) a control group representing a nondeprived AMC (white bars); and (3) a specific dark-exposed control group (DE C). The numbers of animals (n) used in the ISH and WB experiments are indicated next to each bar. E, Images of three adjacent sections around bregma level −3.52 mm from dark-exposed enucleated (DE 7wME) and dark-exposed AMC mice (DE AMC). The corresponding pseudocolor representations of signal intensity differences are displayed next to each triplet of ISH sections. Scale bars, 2 mm. F, G, The line graphs illustrate the relative zif268 expression for the upper (II–IV) and lower (V–VI) layers along the five predefined visual subdivisions (black arrowheads are in correspondence with the small arrowheads in the images in E) measured as the average OD in each segment for DE AMC (gray), DE 7wME (black) next to P45 7wME (red) and P120 7wME (green) animals (Nys et al. 2014). Error bars represent the SEM of the mean OD in each segment. H, I, Comparison of zif268 expression levels in the left visual cortex of four control groups: (1) P120 AMC (black); (2) P45 AMC (stippled black); (3) DE AMC (gray); and (4) DE C (stippled gray). A, Anterior; M, medial; m, monocular; b, binocular; IG, infragranular layers.
