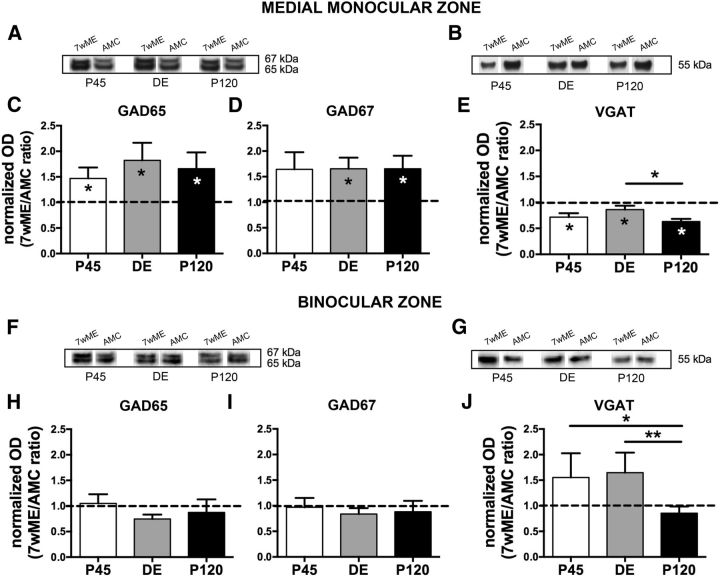
Figure 3.
Long-term ME induced different expression changes of presynaptic inhibitory markers in the contralateral medial monocular and binocular cortices. Representative Western blot bands from functional subdivision-specific homogenates and their molecular weight are shown above the bar graphs for GAD65, GAD67 (A, F), and VGAT (B, G) proteins. ODs of WB results are illustrated as the 7wME expression levels normalized relative to the expression of its corresponding AMC group (7wME/AMC ratio) to allow a direct comparison of protein levels between the different ME groups of P45 (white), DE (gray), and P120 (black) mice. In the medial monocular cortex (A–E) of all experimental groups, a significant increase of GAD65 (C; average 7wME ± SEM, P45, 1.40 ± 0.15; DE, 1.75 ± 0.27; P120, 1.58 ± 0.23) and GAD67 (D; DE, 1.80 ± 0.29; P120, 1.63 ± 0.22; except P45, 1.67 ± 0.28) was observed 7 weeks after ME compared with AMC levels (C: average controls ± SEM, P45, 0.95 ± 0.09; DE, 0.96 ± 0.10; P120, 0.95 ± 0.12; D: P45, 1.02 ± 0.11; DE, 1.09 ± 0.10; P120, 0.99 ± 0.14), whereas the expression of VGAT (E) of all P45, DE, and P120 7wME (average 7wME ± SEM, P45, 0.83 ± 0.07; DE, 0.72 ± 0.04; P120, 0.67 ± 0.05) mice was significantly reduced in relation to AMCs (average controls ± SEM, P45, 1.16 ± 0.06; DE, 0.83 ± 0.06; P120, 1.06 ± 0.02). In contrast, for the binocular cortex (F–J), no significant ME effect was found for GAD proteins (H: average 7wME ± SEM, P45, 1.42 ± 0.17; DE, 1.12 ± 0.12; P120, 1.04 ± 0.18; I: P45, 1.38 ± 0.19; DE, 1.22 ± 0.13; P120, 1.12 ± 0.17) or VGAT (J; average 7wME ± SEM, P45, 1.36 ± 0.11; DE, 1.20 ± 0.20; P120, 0.70 ± 0.08) compared with their AMC (H: average controls ± SEM, P45, 1.35 ± 0.17; DE, 1.50 ± 0.07; P120, 1.19 ± 0.28; I: P45, 1.42 ± 0.18; DE, 1.45 ± 0.08; P120, 1.27 ± 0.30; J: P45, 0.88 ± 0.26; DE, 0.73 ± 0.12; P120, 0.82 ± 0.09). However, P45 and DE mice revealed a higher VGAT ratio compared with P120 mice.

