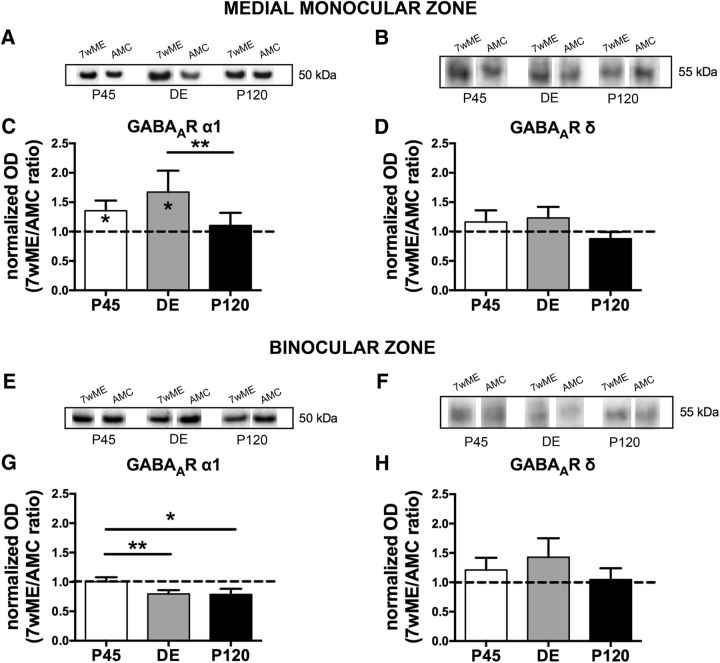
Figure 4.
Long-term ME triggered distinct alterations in the protein expression of the GABAA receptor α1 but not the δ subunit in the contralateral medial monocular and binocular cortices. Representative Western blot bands from functional subdivision-specific homogenates and their molecular weight are shown above the functional subdivision-related bar graphs for the GABAA receptor α1 subunit (A, E) and the GABAA receptor δ subunit (B, F) proteins. In the medial monocular cortex (A–D) of both P45 and DE 7wME (average 7wME ± SEM, P45, 1.27 ± 0.10; DE, 1.27 ± 0.09; P120, 1.02 ± 0.11), the GABAA α1 subunit receptor (C) revealed a significant upregulation compared with AMC levels (average controls ± SEM, P45, 0.94 ± 0.10; DE, 0.76 ± 0.15; P120, 0.93 ± 0.03), whereas no significant changes in expression level were observed for the GABAA receptor δ subunit (D; average 7wME ± SEM, P45, 1.23 ± 0.16; DE, 0.99 ± 0.18; P120, 0.80 ± 0.09; average controls ± SEM, P45, 1.06 ± 0.11; DE, 0.82 ± 0.08; P120, 1.02 ± 0.13). The binocular cortex revealed no significant changes (G, H) for either subunit of the GABAA receptor (G: average 7wME ± SEM, P45, 1.35 ± 0.05; DE, 1.08 ± 0.07; P120, 1.04 ± 0.06; average controls ± SEM, P45, 1.34 ± 0.09; DE, 1.36 ± 0.07; P120, 1.32 ± 0.14; H: average 7wME ± SEM, P45, 1.34 ± 0.13; DE, 1.17 ± 0.18; P120, 1.00 ± 0.17; average controls ± SEM, P45, 1.11 ± 0.16; DE, 0.82 ± 0.14; P120, 0.95 ± 0.07).

