
Figure 3.
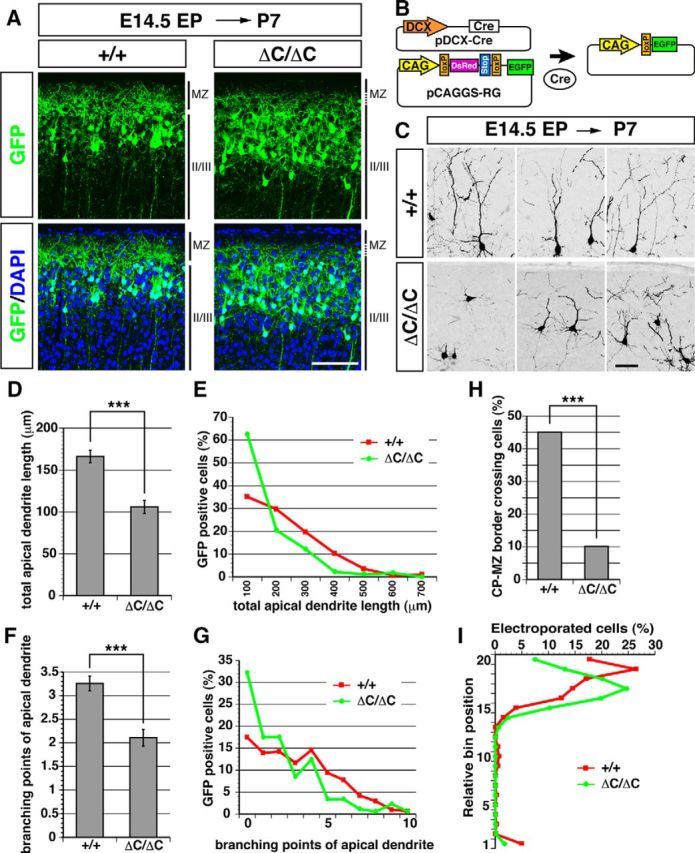
Development of apical dendrites is abnormal in mice lacking the Reelin CTR. A, In utero electroporation of GFP expression vectors was performed at E14.5, and mice were fixed at P7. The upper region of cerebral cortical slices is shown. II/III, Layer II/III. In ΔC-KI mice, the border between MZ and layer II/III is blurred. Scale bar, 100 μm. B, Schematic drawing represents the two plasmids used for sparse labeling of neurons (pDCX-Cre and pCAGGS-RG, left), and the plasmid resulting from Cre-mediated recombination (right). In the absence of pDCX-Cre, pCAGGS-RG expresses DsRed because of the presence of an SV40 polyadenylation sequence (Stop) after the DsRed, whereas in the presence of pDCX-Cre, Cre-mediated recombination excises the DsRed expression cassette and the Stop sequence through two loxP sites, and the resulting plasmid expresses GFP. To reduce the probability of recombination, the concentration of pDCX-Cre was reduced to one-five-hundredth compared with that of pCAGGS-RG, resulting in a small number of GFP-positive cells being observed. C, Sparse labeling by pCAGGS-RG/pDCX-Cre coelectroporation clearly shows the misorientation and hypertrophy of apical dendrites in ΔC-KI mice. Three representative images are shown. Scale bar, 50 μm. D, Quantification of the total apical dendrite length (p = 3.729 × 10⁻⁸, >30 neurons from each of three different brains per group were analyzed). E, Line graph of the percentage of GFP+ cells versus total apical dendrite length. F, Quantification of branching points of apical dendrites (p = 5.949 × 10⁻⁷, >30 neurons from each of three different brains per group were analyzed). G, Line graph of the percentage of GFP+ cells versus branching points of apical dendrites. H, Quantification of the percentage of GFP+ cells with apical dendrites that cross the border between the cortical plate and MZ (p = 5.307 × 10⁻¹³, >50 neurons from each of three different brains per group were analyzed). I, Relative bin position of labeled neurons. Bin positions were calculated by measuring the distance from the ventricular surface to labeled cells and from the ventricular surface to the top of the cortical plate (>100 neurons from each of three different brains per group were analyzed). D, F, H, Error bars indicate mean ± SEM. ***p < 0.001 (Mann–Whitney U test).