
Figure 3.
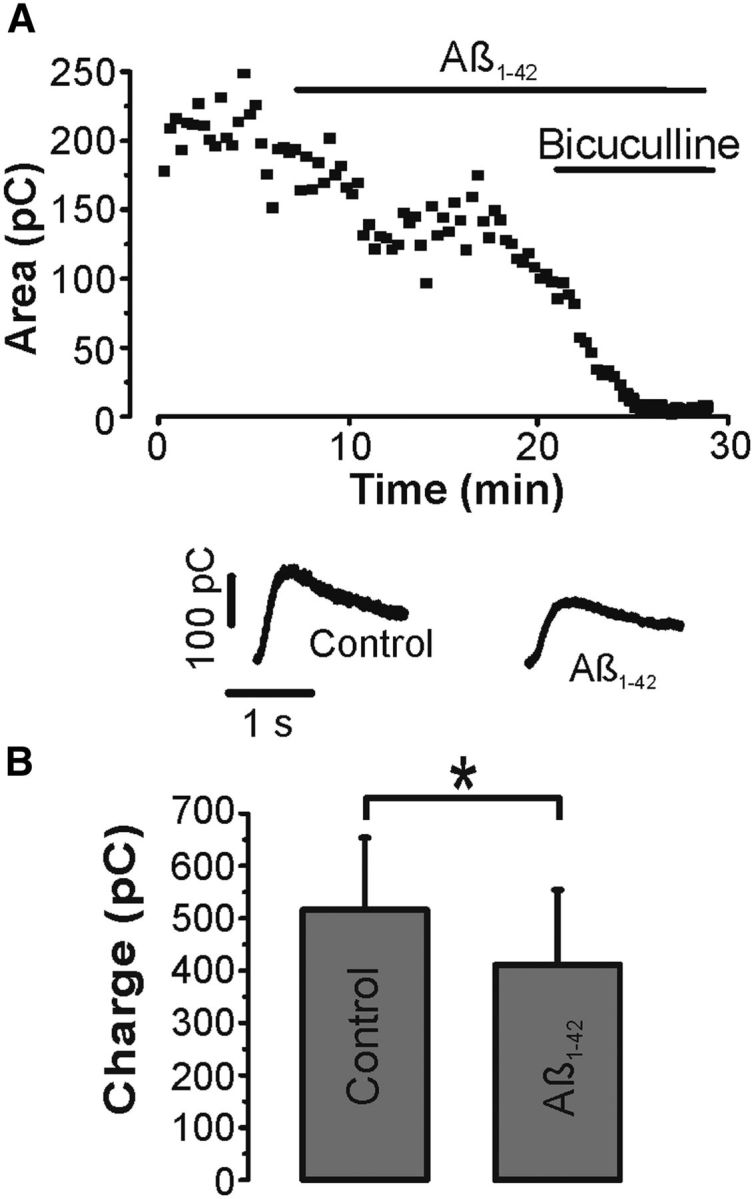
Aβ decreases agonist-evoked GABAA responses. A, Time course (■) and sample traces of transient outward currents generated by brief puffs of 0.5 mm isoguvacine repeated every 20 s in control, Aβ (1 μm), and bicuculline (10 μm). B, Summary histograms (mean ± SEM) of isoguvacine responses in Aβ versus control (n = 6) show a statistically significant difference. *p < 0.05 (paired t test).