
Figure 1.
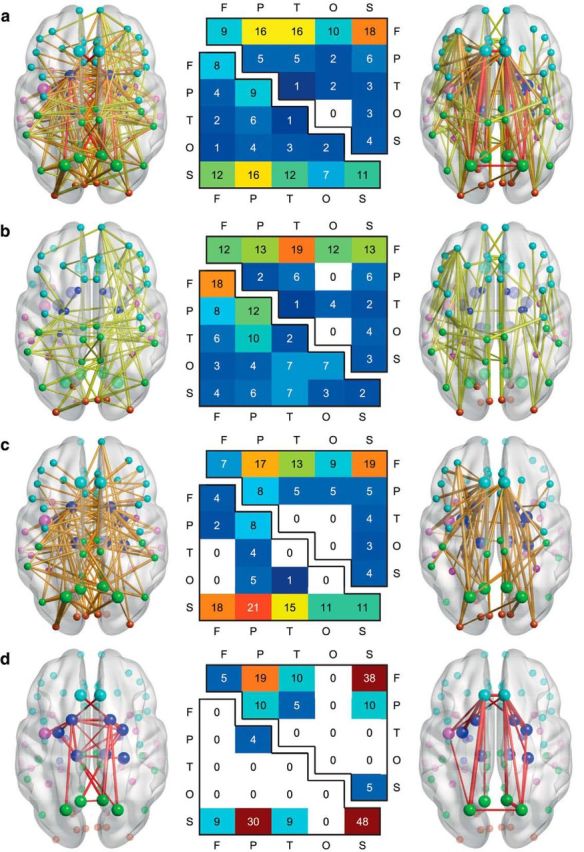
Developmental changes in structural connectivity. a illustrates the anatomical arrangement of the subset of edges identified by the NBS (Zalesky et al., 2010a) as showing significant decreases (left) and increases (right) in streamline density over time, with the thickness of each connection weighted by its associated one-tailed t test statistic (FWE corrected, p < 0.05). Edge color represents connection type: peripheral (yellow), feeder (orange), and hub–hub (red), with larger nodes corresponding to hub regions. Node color represents the assignment of each region of interest to one of five broad anatomical divisions: frontal (cyan), parietal (lime), temporal (magenta), occipital (orange-red), or subcortical (blue). The center panel illustrates the anatomical distribution of the developmental decreases (lower triangular matrix) and increases (upper triangular matrix) in connectivity based on the classification of edges according to the anatomical divisions they interconnected. The values in these matrices represent relative proportions, calculated as the ratio between (1) the frequency of edges linking each pair of divisions and (2) the total number of edges belonging to the two categories. Illustrated in b–d are peripheral, feeder, and hub–hub connections, respectively, extracted from the NBS subnetworks in a.