
Figure 2.
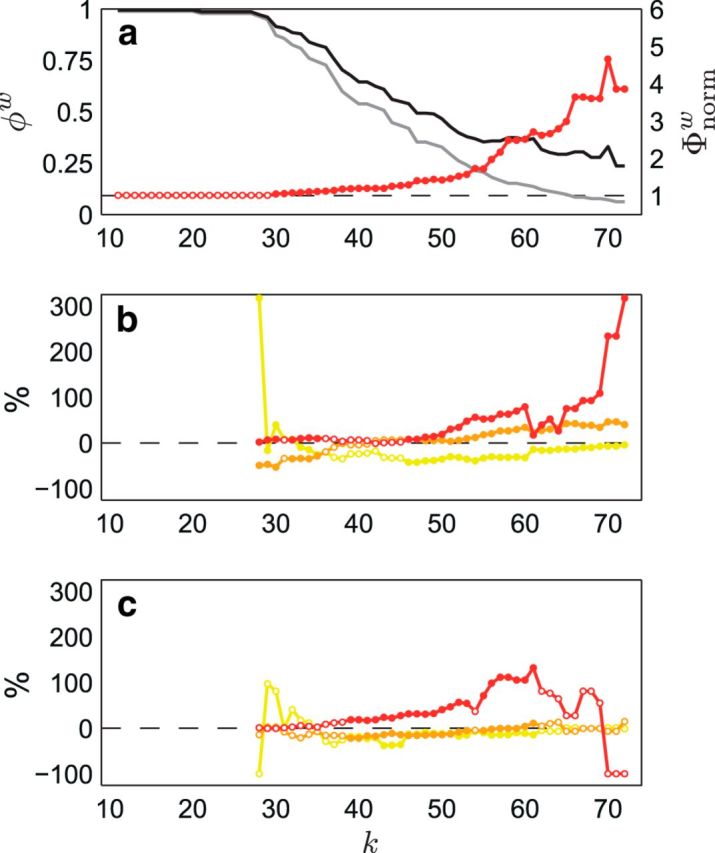
Rich-club curves and magnitude of developmental changes in peripheral, feeder, and hub–hub connections. a shows the normalized rich-club coefficients, Φnormw(k) (red), for the follow-up group-averaged streamline density-weighted network. Weighted rich-club coefficients, φw(k) (black), were found to be significantly greater than those derived from randomized networks, φrandw(k) (gray), for a range of k from 30 to 72 (one-tailed, p < 0.05; filled/solid red markers), indicating robust rich-club organization in the network. b and c show the percentage difference between observed and expected proportions at each level of k for each connection type [peripheral (yellow), feeder (orange), and hub–hub (red)] in the subnetwork showing decreased streamline density over time (b) and the subnetwork showing increased streamline density over time (c). χ2 analysis of the difference between the observed and expected proportions (also at each level of k) revealed a significant effect of connection type (p < 0.05; filled/solid markers) in both the subnetwork showing decreased streamline density over time (for each k in the range 27 < k < 36 except k = 31, and 45 < k < 73; b) and the subnetwork showing increased streamline density over time (for each k in the range 30 < k < 62 except k = 54; c). As can be seen, a disproportionate number of hub–hub connections showed developmental changes, particularly at levels of k that coincide with the topological rich-club effect (a).