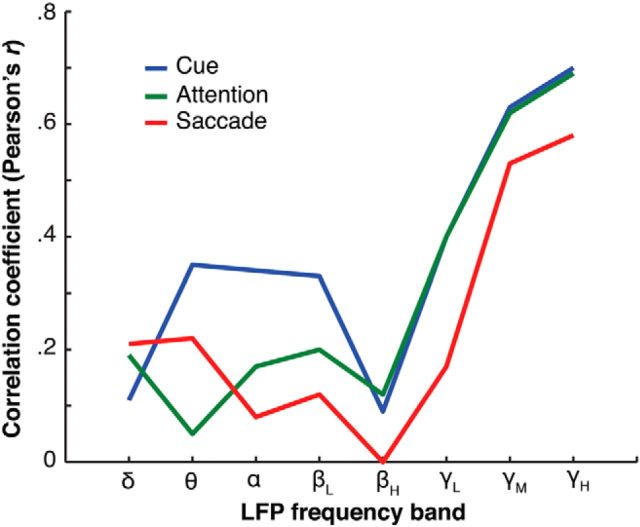
Figure 6.
Spike–LFP correlations for each frequency band. The decoding accuracy of single LFP channels is correlated with the decoding accuracy of the single units recorded on the same channel. The Pearson's correlation coefficient is plotted on the y-axis. The x-axis represents all eight frequency bands. Each colored line indicates a different task epoch (cue, attention, or saccade).

