
Figure 4.
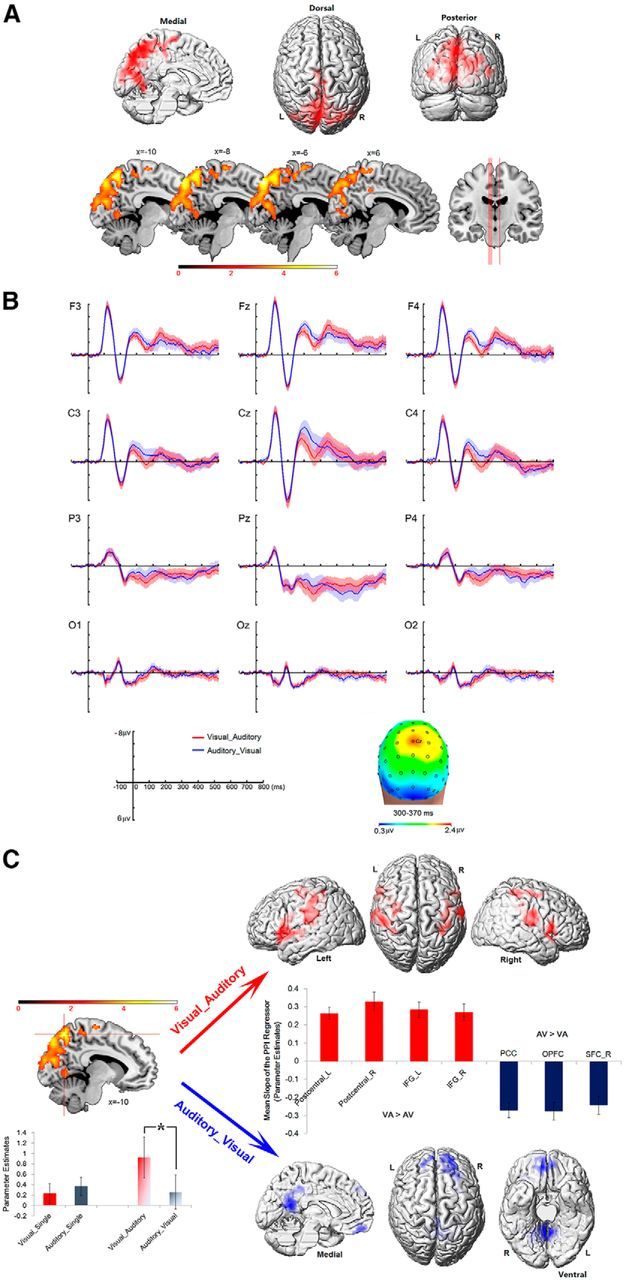
Neural activity in the bimodal trials. A, Visual_Auditory > Auditory_Visual. The medial dorsal visual stream, including the precuneus and the human V6A, showed significantly higher neural activity in the Visual_Auditory trials than in the Auditory_Visual trials. B, Grand-average ERP waveforms in the 800 ms poststimulus interval at representative analyzed electrodes and topography for the Visual_Auditory and the Auditory_Visual trials. In all the ERP graphs, a low-pass filter (30 Hz at 24 dB/octave) was used for visual clarity. The divergence between the two bimodal behavioral conditions started to reach significance at 250 ms after the onset of the target. The topography of the Visual_Auditory versus Auditory_Visual difference voltage maps over the 300–370 ms period was overlaid on the three-concentric head model. The red and blue shadows indicated the SE of ERPs in the two bimodal behavioral conditions. C, PPI analysis based on neural activity in the precuneus, with the contrast Visual_Auditory > Auditory_Visual as the psychological factor. Left, Mean parameter estimates in the unimodal visual and auditory trials and in the bimodal Visual_Auditory and Auditory_Visual trials were extracted from the precuneus. Right top, The precuneus showed significantly higher functional connectivity with the bilateral IFG and the bilateral postcentral gyrus in the Visual_Auditory trials than in the Auditory_Visual trials. Right bottom, The precuneus showed significantly higher functional connectivity with the OPFC and the PCC in the Auditory_Visual trials than in the Visual_Auditory trials. Mean parameter estimates of the PPI regressor were extracted from the activated areas. *p < 0.05. The error bars indicate SEs.