
Figure 5.
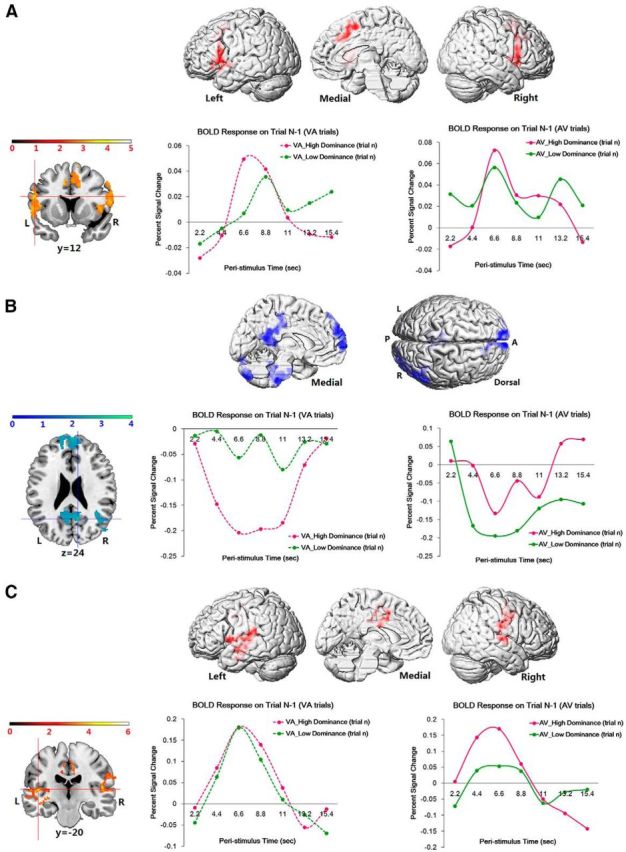
Variations of prestimulus neural activity as a function of the size of sensory dominance. A, Top, Positive parametric modulation effect of visual dominance on prestimulus neural activity in the VA trials. Bottom, For example, in the left IFG, the height of BOLD responses in the trials before the high visual dominance VA trials was significantly higher than in the trials before the low visual dominance VA trials (left). In contrast, the height of BOLD responses was comparable between the Trials N − 1 of the high versus low auditory dominance AV trials (right). The other activated regions showed a similar pattern of prestimulus neural activity as the left IFG. B, Top, Negative parametric modulation effect of visual dominance on prestimulus neural activity in the VA trials. Bottom, For example, in the PCC, the BOLD responses in the trials before the high visual dominance VA trials were significantly more deactivated than in the trials before the low visual dominance VA trials (left). In contrast, the height of BOLD responses was comparable between the Trials N − 1 of the high versus low auditory dominance AV trials (right). The other activated regions in the DMN showed a similar pattern of prestimulus neural activity as the PCC. C, Top, Positive parametric modulation effect of auditory dominance on prestimulus neural activity in the AV trials. Bottom, For example, in the left STG, the height of BOLD responses in the trials before the high auditory dominance AV trials was significantly higher than in the trials before the low auditory dominance AV trials (right). In contrast, the height of BOLD responses was comparable between the Trials N − 1 of the high versus low visual dominance VA trials (left). The other activated regions showed similar pattern of prestimulus neural activity as the left STG.