
Figure 7.
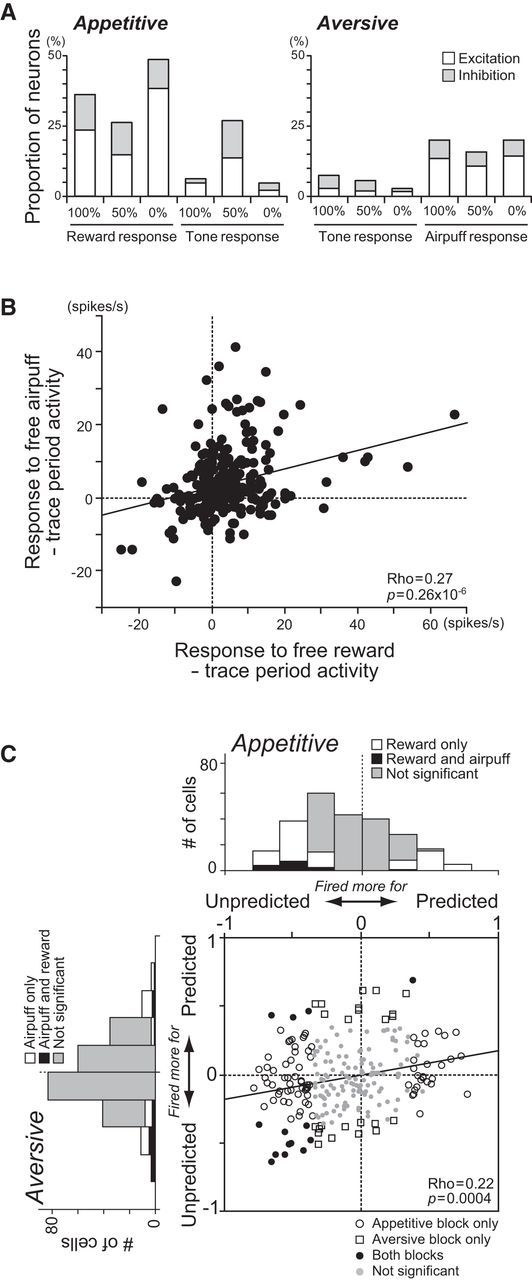
Responses to USs. A, Proportions of neurons that showed significant changes in excitatory (white) or inhibitory (gray) responses to the USs and tones relative to the preceding trace period activity (p < 0.05). The data are shown separately for outcome predictability (i.e., 100%, 50%, and 0%) in the appetitive (left) and aversive (right) blocks. B, The directions of changes in the response to free rewards and airpuffs were the same for many neurons. C, Changes in the US response by the preceding CS. The abscissa indicates the correlation coefficient between the reward predictability implied by appetitive CSs and the reward response. The ordinate indicates the correlation coefficient between the airpuff predictability implied by aversive CSs and the airpuff response. The open circles, squares, and black dots indicate neurons with a statistically significant correlation for the appetitive block only, aversive block only, and both, respectively (p < 0.05); gray dots are neurons with no significant correlations. The marginal histograms show the distributions of the correlation coefficients. The white and black bars indicate neurons with statistically significant correlations for reward or airpuff only and for both, respectively. The gray bars indicate no significant correlation.