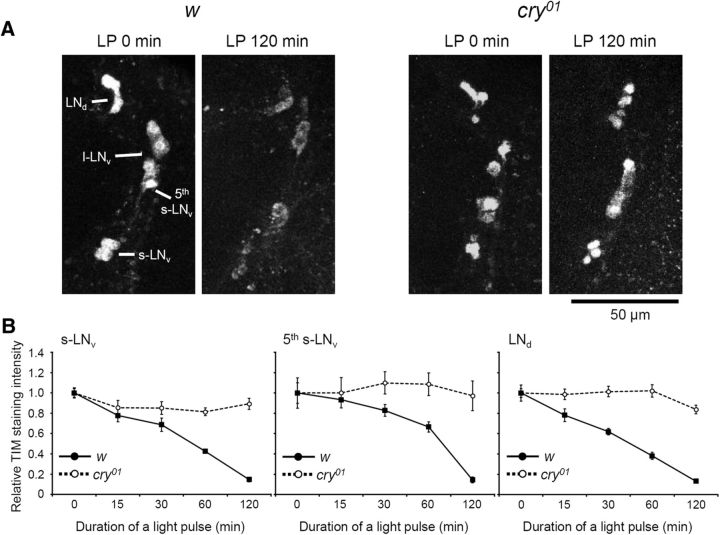
Figure 1.
TIM degradation kinetics after light pulses (LP). Flies were exposed to light pulses of different durations that started at different ZTs until ZT 21, when the flies were collected. A, TIM immunostaining in LN cells in w control brains (left 2 panels) and cry01 mutant brains (right 2 panels) at ZT 21. PDF costaining was also performed to distinguish the groups of LN cells (images not shown). B, TIM degradation kinetics in three LN groups in response to different light pulses. To normalize data, TIM staining intensity with no light pulse was set to 1.0. The mean ± SEM staining intensity was calculated from 10 hemispheres of 10 different brains. TIM staining was almost completely abolished after a 120 min light pulse in w control brains (solid lines), whereas it remained at a high level in cry01 mutant brains (dashed lines).

