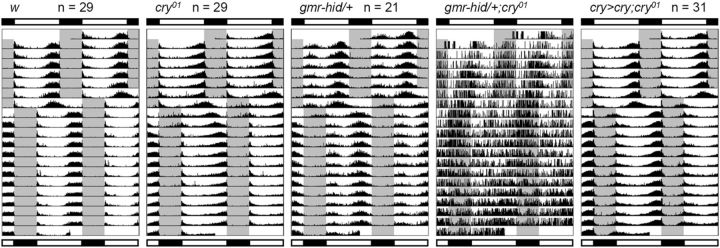
Figure 3.
Activity rhythms under 16/8 h LD before and after an 8 h LD phase shift. The gray area in the actograms indicates the dark phase. Bars above and below the actograms indicate light conditions before and after the LD phase shift, respectively. Actograms show mean activity rhythms calculated from the number of flies indicated next to the strain names. Because gmr–hid/+;cry01 flies were not able to synchronize to LD cycles, the actogram is of a representative individual fly. cry>cry;cry01 indicates w;cry–gal4 #39/uas–cry;cry01.

