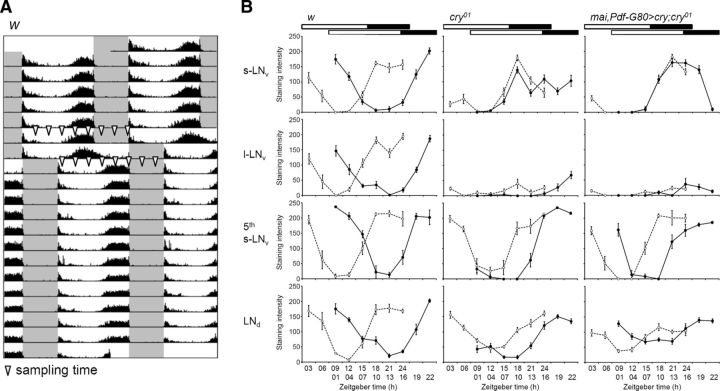
Figure 6.
PDP1 cycling in LN clock neurons before and after an 8 h LD phase shift. A, Sampling schedule for PDP1 staining. The arrowheads on the actogram indicate when flies were sampled for immunostaining. B, Mean ± SEM PDP1 staining intensity was calculated from nine hemispheres of nine different brains for each time point in the course of a single experiment. The open circles with dashed lines and filled circles with solid lines indicate the PDP1 cycling before and after the LD phase shift, respectively. PDF costaining was performed on all brains to distinguish different LN groups (images not shown). The bars above the graphs indicate light conditions.

