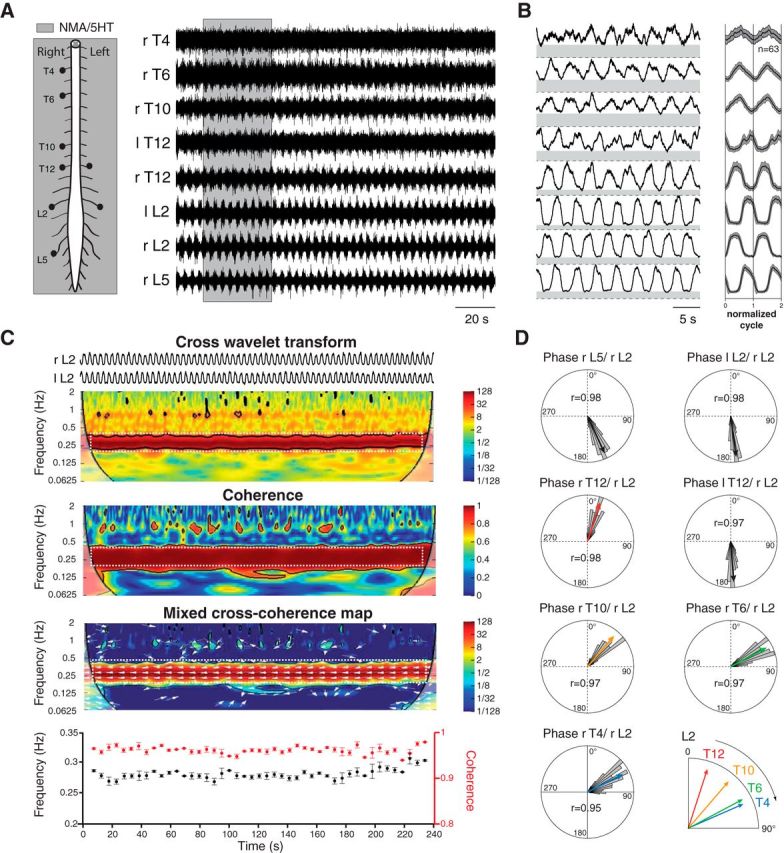
Figure 1.

Thoracolumbar bursting coordination during fictive locomotion. A, Schematic diagram of the experimental procedure (left). Simultaneous recordings from lumbar and thoracic ventral roots during an episode of locomotor-like activity induced by NMA (15 μm) and 5-HT (15 μm; right). B, High-pass filtered, rectified, and smoothed traces (left) taken from the sequence presented in A (gray area). The right panel illustrates the mean normalized cycle repeated two times (n = 63 cycles, right L2 taken as reference). C, Example of the wavelet analysis performed between pairs of recordings. Cross wavelet transform (top) and wavelet coherence between bilateral L2 activities revealed the common high-power frequencies and correlation between signals over time, respectively. The power and coherence of the frequencies between traces are color coded with warm and cool colors to indicate high and low values, respectively. Black contours delimit areas within the 5% significance level. Regions of interest (white dashed rectangles) were defined from the map obtained by mixing the results of the cross-wavelet and wavelet coherence (bottom map). White arrows indicate the phase relationship between each significant frequency components (the left direction indicates an out-of-phase relationship). The bottom graphs illustrate the evolution of the frequency (black markers) and coherence (red markers) over time within the regions of interest. Each marker represents the mean values obtained using bins of 1 s. D, Polar plot representations of the phase relationships between the bursting activities recorded from various ventral roots and the right L2. The direction and length of the red arrows indicate the mean phase value and the r value, respectively. The distributions of raw values are also provided as histograms (using bins of 5°). r, Right; l, left; T, thoracic; L, lumbar.
