
Figure 2.
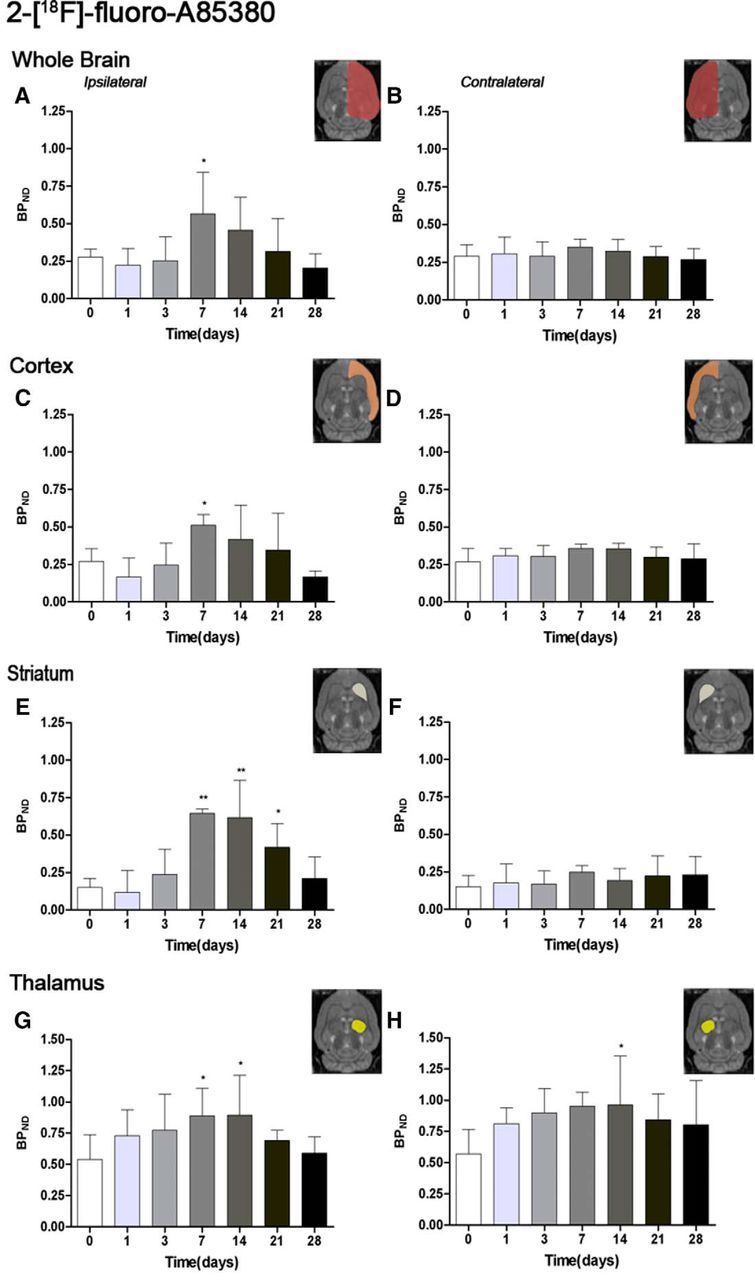
Time course of the progression of the 2-[18F]-fluoro-A85380 PET signal before and after cerebral ischemia. BPND (mean ± SD) of 2-[18F]-fluoro-A85380 was quantified in eight VOIs. The entire ipsilateral cerebral hemisphere (A), contralateral cerebral hemisphere (B), ipsilateral cortex (C), contralateral cortex (D), ipsilateral striatum (E), contralateral striatum (F), ipsilateral thalamus (G), and contralateral thalamus (H) are shown. The upper right panels of each figure show the selected brain ROIs for the quantification defined on a slice of a MRI (T2W) template. Rats (n = 6) were repeatedly examined by PET before (day 0) and at 1, 3, 7, 14, 21, and 28 d after ischemia. *p < 0.05 and **p < 0.01 compared with control.