
Figure 2.
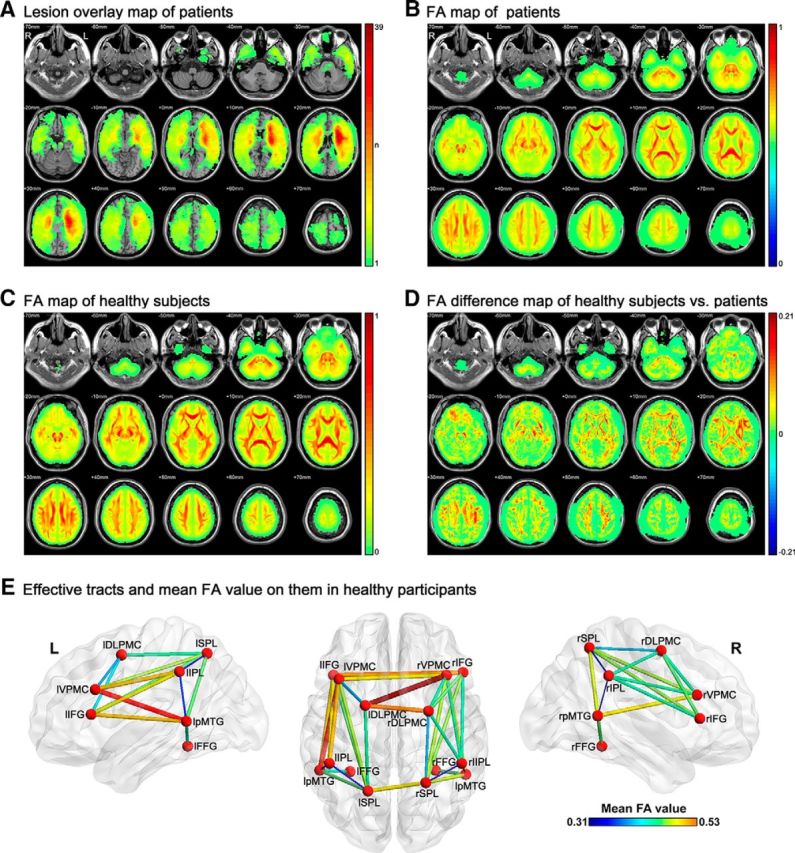
Raw imaging schematic of participants and the tracts successfully tracked between the tool-relevant seeds. A, Lesion map of patients on each voxel. The value of each voxel is the number of patients with lesions on it. B, Mean FA maps of patients. C, Mean FA maps of healthy subjects. D, Mean FA difference map of healthy subjects minus patients. For B–D, the color bar indicates the mean FA value per voxel. E, Fourteen seeds and 33 tracts successfully tracked between these seeds in 49 healthy adults. The thickness and color of the tracts indicate the mean FA values. Full names of the seeds are listed in Table 1.