
Figure 7.
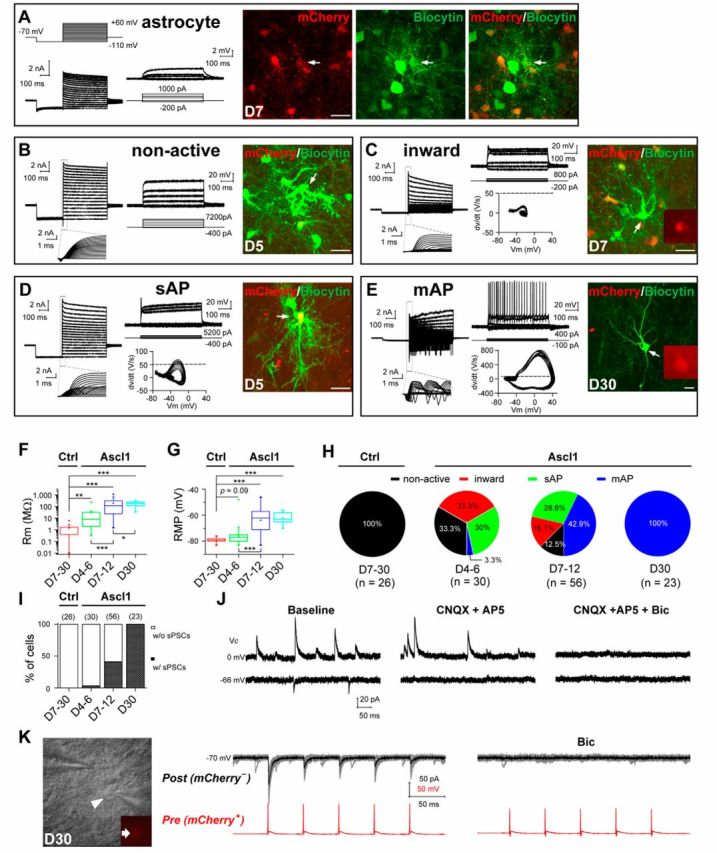
Functional characterization of iN cells generated in vivo. A, Membrane properties of an mCherry+ astrocyte recorded in an acute dorsal midbrain slice prepared from a WT mouse that was infected with the control virus AAV–mCherry at 7 DPI. Membrane currents (left) and voltages were recorded in voltage- and current-clamp modes, respectively, in responses to the step voltage or current commands. Fluorescence images from left to right: mCherry, biocytin staining, and superimposed fluorescence. Arrow, The cell recorded and filled with biocytin. Note the spread of biocytin to neighboring astrocytes, including several mCherry+ cells. B–E, Membrane functions of iN cells (mCherry+) in slices of the dorsal midbrain that were prepared from WT mice infected with AAV–Ascl1/mCherry on day 5 (B, D), day 7 (C), or day 30 (E) after infection. Boxed regions, Membrane currents at a higher time resolution. Phase plots (Vm vs dV/dt) of the initial 100 ms responses is used to detect the voltage threshold of the AP (indicated by dotted lines). The arrows in the fluorescence images (mCherry and biocytin staining) indicate the recorded cells. F, G, Membrane resistance (Rm; F) and RMP (G) of astrocytes and iN cells over days after infection. H, Percentages of induced cells with four different degrees of membrane excitability (non-active, inward, sAP, and mAP) over days after infection with the control AAV–mCherry or AAV–Ascl1/mCherry viruses. I, Percentages of induced cells showing sPSCs at different time points after infection with the control AAV–mCherry or AAV–Ascl1/mCherry viruses. J, Representative traces of spontaneous glutamatergic (inward) and GABAergic (outward) synaptic currents, recorded at Vclamp = −66 and 0 mV, respectively, in an iN cell at 25 DPI. CNQX + AP-5 and bicuculline selectively blocked spontaneous glutamatergic and GABAergic events, respectively. K, Recording of synaptic output from an induced GABAergic neuron onto one neighboring tectal neuron in the slice of a WT mouse at 30 DPI of the virus AAV–Ascl1/mCherry. DIC image showed the simultaneous recordings on a presynaptic iN cell (mCherry+, arrow) and a postsynaptic (mCherry−) neuron. Postsynaptic currents (at Vclamp = −70 mV) were elicited by a train of APs (20 Hz) in the presynaptic iN cell and completely blocked by bicuculline (20 μm). Scale bars: A–E, 20 μm. Ctrl, Control. *p < 0.05; **p < 0.01; ***p < 0.001. Error bars indicate SEM.