Figure 4.
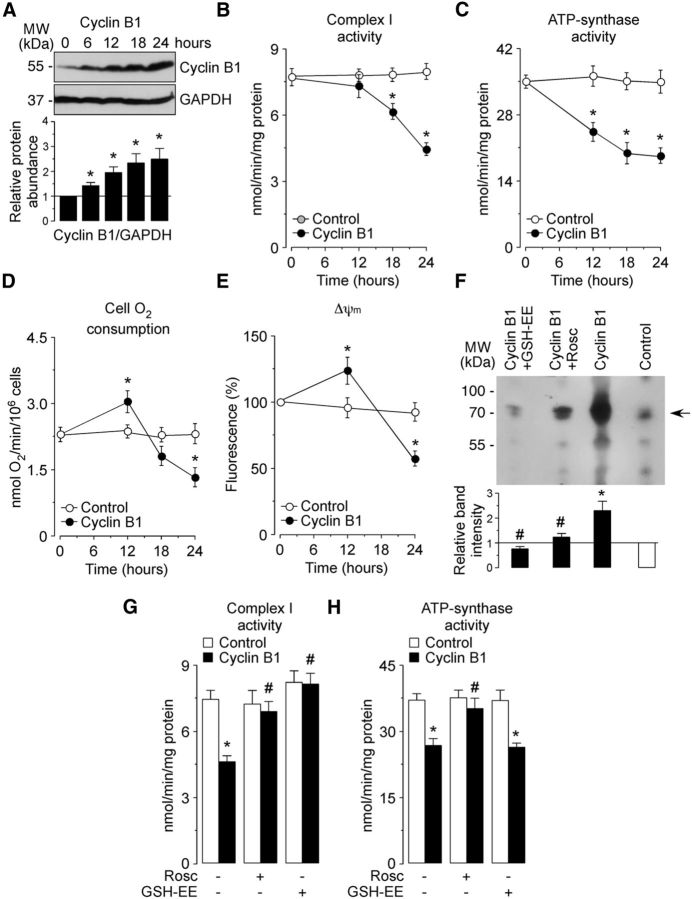
Cyclin B1–Cdk1 activation inhibits ATP synthase, leading to oxidative damage to complex I. HEK293T cells were transfected with 0.8 μg/106 cells pIRES2–EGFP, either empty (Control; expressing GFP) or containing the full-length cDNA of human cyclin B1 (Cyclin B1; expressing both cyclin B1 and GFP). A, Western blots of cell extracts were probed sequentially with antibodies to cyclin B1, followed by GAPDH as loading control. A representative Western blot is shown of three. Bar graphs represent the relative cyclin B1 protein abundance compared with 0 h (immediately after transfection). Each bar represents the mean ± SEM of three independent cell cultures (n = 3). *p < 0.05 versus 0 h. B, Mitochondrial complex I activity was measured by spectrometry at different times after transfections. *p < 0.05 versus control. C, ATP synthase activity was measured by spectrometry at different times after transfections. *p < 0.05 versus control. D, HEK293T cells were suspended in HBSS, and the rate of oxygen consumption was measured at different times after transfections by using with a Clark-type dissolved oxygen electrode. *p < 0.05 versus control. E, Δψm was assessed by flow cytometry in HEK293T at different times after transfections. *p < 0.05 versus control. F, HEK293T cells were transfected with 0.8 μg/106 cells pIRES2–EGFP (control) or pIRES2–cyclin B1–EGFP (cyclin B1) either in the absence of presence of Rosc (10 μm) and GSH-EE (1 mm) for 24 h. Cyclin B1 induced complex I oxidation, as judged by the increase in oxidized proteins detected by immunoblotting from isolated biotin–NEM-labeled mitochondrial complex I subunits, which was abrogated by Rosc and GSH-EE. A representative Western blot is shown of three. Bar graphs represent the relative band intensity compared with control. Each bar represents the mean ± SEM of three independent Western blots (n = 3). *p < 0.05 versus control; #p < 0.05 versus cyclin B1. G, H, HEK293T cells were transfected and treated as in F. Mitochondrial complex I activity (G) and ATP synthase activity (H) were measured by spectrometry at 24 h after transfections. *p < 0.05 versus control; #p < 0.05 versus cyclin B1. In B–E, G, and H, data are expressed as the mean ± SEM, from three or four independent cell cultures (n = 3–4). MW, Molecular weight.

