
Figure 5.
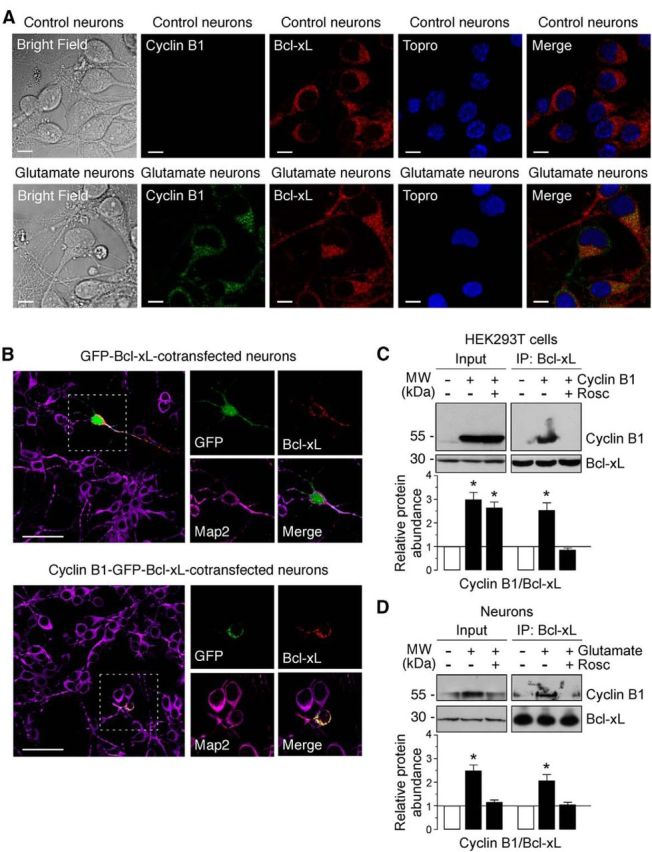
Cyclin B1–Cdk1 localizes to mitochondria in neurons on excitotoxic stimulus. A, Neurons were treated or not (control) with 100 μm glutamate for 5 min and were further incubated in culture medium for 12–14 h. Cyclin B1 and Bcl-xL were detected by immunocytochemistry. Scale bars, 10 μm. Microphotograph reveals colocalization of cyclin B1 with Bcl-xL in neurons. B, Neurons were cotransfected with plasmids encoding either GFP (0.8 μm/106 cells pcDNA3–GFP; control) or cyclin B1 fused with GFP (0.8 μm/106 cells pcDNA3–cyclin B1–GFP; cyclin B1–GFP) and Bcl-xL (0.8 μm/106 cells p8–Bcl-xL) for 12–14 h. Microphotograph reveals that cyclin B1–GFP, but not GFP (control), colocalizes with Bcl-xL. Neurons were immunostained with the neuronal marker Map2 (violet). Scale bars, 50 μm. C, HEK293T cells were transfected with 0.8 μg/106 cells pIRES2–EGFP, either empty (−Cyclin B1) or containing the full-length cDNA of human cyclin B1 (Cyclin B1), in either the absence or presence of Rosc (10 μm). At 24 h after transfections, cellular extracts were obtained and immunoprecipitated with anti-Bcl-xL antibody and analyzed by Western blot for cyclin B1 and Bcl-xL. Of the whole cellular extracts used for immunoprecipitation, 10% were loaded on SDS-PAGE as an input control. Coimmunoprecipitation assays revealed that cyclin B1 coprecipitated with Bcl-xL. A representative Western blot is shown of three. Bar graphs represent the relative band intensity compared with control. Each bar represents the mean ± SEM of three independent cell cultures (n = 3). *p < 0.05 versus control (−Cyclin B1). D, Neurons were treated or not (−Glu) with 100 μm glutamate for 5 min and were further incubated in culture medium for 20 h, in either the absence or presence of Rosc (10 μm). Coimmunoprecipitation assay was performed as indicated in C. Cyclin B1 coprecipitated with Bcl-xL in neurons on excitotoxic stimulus. A representative Western blot is shown of three. Bar graphs represent the relative band intensity compared with control. Each bar represents the mean ± SEM of three independent neuronal cultures (n = 3). *p < 0.05 versus untreated (−Glu) neurons. MW, Molecular weight.