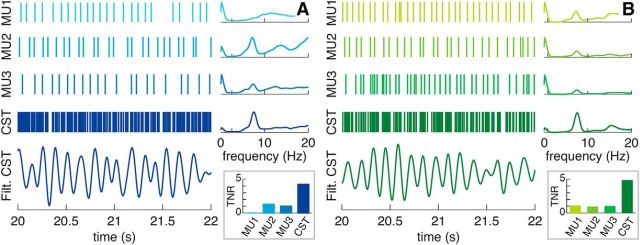
Figure 2.
Representative example of neural drives to a pair of antagonist muscles in an ET patient. A, Data from the wrist extensors. B, Data from the wrist flexors. Each panel shows, from top to bottom, MU1–MU3, the spike trains of three of the motor units detected (of a total of 9 and 5 respectively), and their power spectral density; CST, the CST constructed by pooling the spike trains of all the detected motor units, and its power spectral density; Filt. CST, the filtered CST (3–10 Hz, zero-phase), showing a very clear oscillation at the tremor frequency. The inset represents the TNR for each motor unit and composite spike train (see Materials and Methods). Note how the spectral peak at the tremor frequency (TNR) increases its relative height when the motor unit spike trains are pooled into a CST. MU, Motor unit.

