Figure 3.
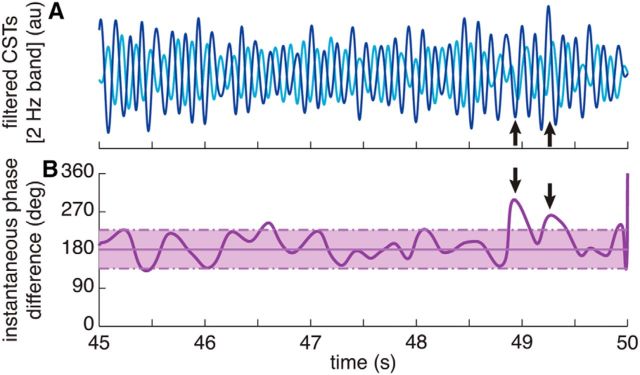
Representative example of the instantaneous phase difference between tremorogenic neural drives to an antagonist muscle pair. A, Narrow band (±1 Hz with respect to the tremor frequency) filtered CSTs representing the neural drive to the wrist extensors (dark blue) and flexors (light blue). B, Instantaneous phase difference between the neural drives computed with the Hilbert transform (thick purple trace), with its mean ± SD (solid and dashed thin purple lines) calculated over the entire 30 s analysis window. The arrows indicate two brief fluctuations from the out-of-phase (180°) pattern otherwise characteristic of this trial, as reflected by the small SD over the mean. This figure illustrates the ability of the proposed method to detect fluctuations in the phase difference between tremorogenic neural drives. Data from the same trial as in Figure 2; Figure 5D shows the circular phase histogram for the entire trial.

