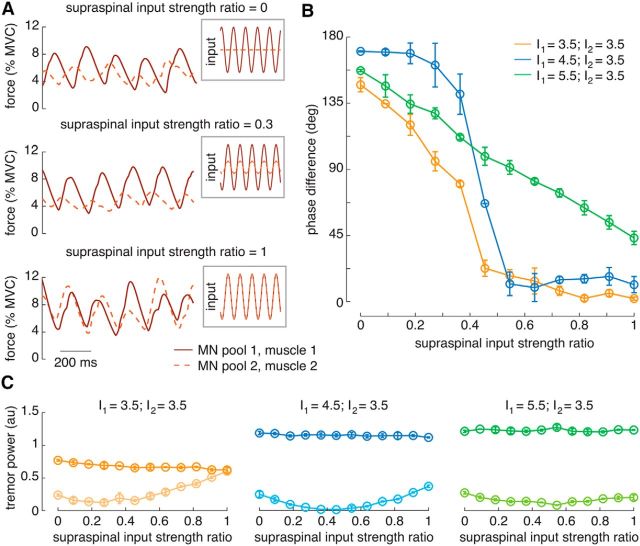
Figure 4.
Simulations illustrating relevant properties of the neural drives to antagonist muscles as a function of the relative amplitude of the supraspinal tremor input. A, Examples of oscillatory input to the antagonistic motoneuron pools (insets) and resultant muscle force for three supraspinal input strength ratios during rest tremor (I1 = 3.5 nA; I2 = 3.5 nA). B, Mean phase difference between neural drives to the antagonist muscles as function of the relative amplitude of supraspinal tremor input, indicating a strong association between both variables for the three contraction levels simulated. C, Spectral power at the tremor frequency for the CST comprising all the motoneurons, as a function of the relative amplitude of supraspinal input. Each panel shows one of the voluntary drive levels; motoneuron pool #1 is represented in dark colors and motoneuron pool #2 in light colors. Data in B are represented as the circular mean (circles) ± SD (whiskers) of the three trials simulated for each of the 12 supraspinal input strength ratios; similarly, C represents the mean ± SD. All current amplitudes in nanoamperes. MN, Motoneuron.

