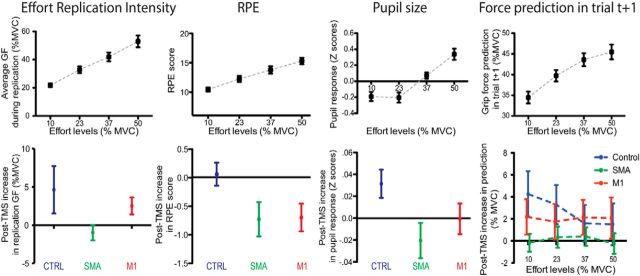
Figure 3.
Continuous measurements of effort perception. Each column corresponds to a different effort perception variable. Error bars indicate the SEM. Top row, Relationship between each variable and the effort intensity condition. Bottom row, Changes observed in the four continuous variables after cTBS application to each of the three cTBS sites. Main effects of cTBS sites are illustrated for all variables except the force prediction in trial t+1, in which the EFFORT INTENSITY × cTBS SITE interaction is shown instead, because this was the only significant result obtained from the statistical analysis.

