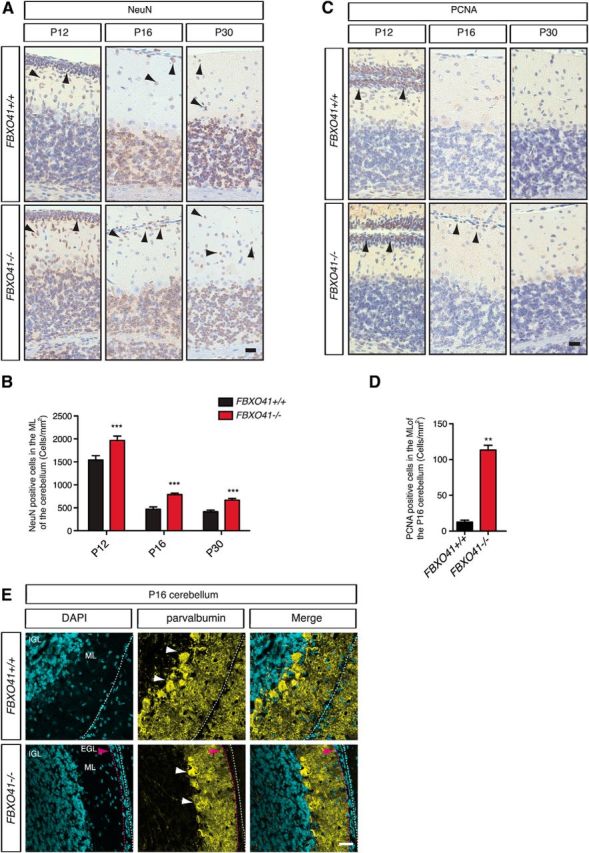
Figure 8.

FBXO41−/− mice show delayed neuronal migration in the cerebellum. A, Representative images of 5-μm-thick sections from P12, P16, and P30 FBXO41+/+ and FBXO41−/− cerebella subjected to NeuN staining. Arrowheads indicate NeuN+ cells. Scale bar, 20 μm. B, Quantification of the density of NeuN+ cells (cells/mm2) in ML at the indicated ages. Three independent FBXO41+/+ and FBXO41−/− littermates for all the indicated ages (P12, P16, P30) were included in the analyses (two-way ANOVA, ***p < 0.001, mean + SEM). C, Representative images of 5-μm-thick sections from FBXO41+/+ and FBXO41−/− cerebella at P12, P16, and P30 subjected to PCNA staining. Arrowheads indicate PCNA+ cells. Scale bar, 20 μm. D, Quantification of PNCA+ cells in the ML of cerebella from three independent FBXO41+/+ and FBXO41−/− littermates (Student's t test, **p < 0.01, mean + SEM). E, Confocal images of cryosections from P16 FBXO41+/+ and FBXO41−/− cerebella subjected to immunohistochemistry using antibodies against parvalbumin (Purkinje cells and interneurons). Scale bar, 100 μm. Red arrowhead indicates residual EGL in the P16 FBXO41−/− cerebella. ML, Molecular layer.
