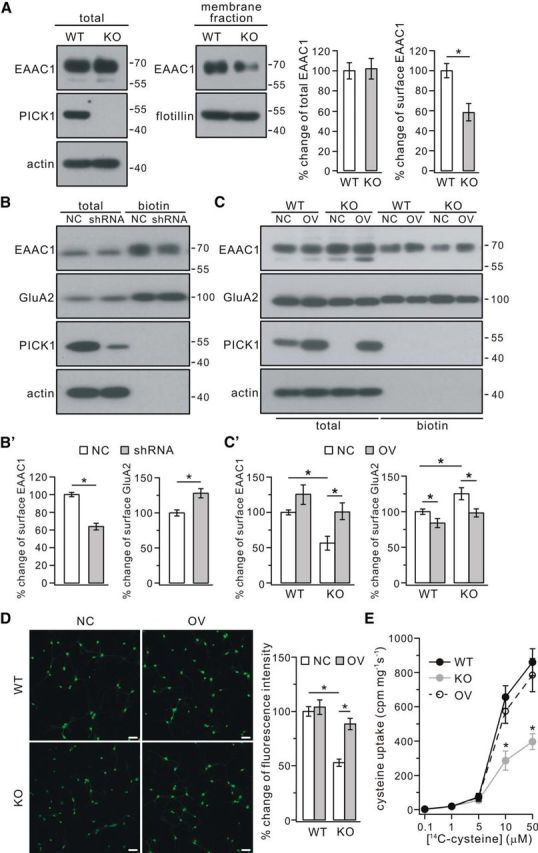
Figure 6.

Surface EAAC1 was reduced in PICK1−/− mice. A, EAAC1 in the membrane fraction decreased in PICK1−/− mice (KO) at 4 months. Actin and flotillin were used as loading controls of total and membrane fractions, respectively. Percentage changes of EAAC1 expression were 100 ± 8% (WT, total), 102 ± 10% (KO, total), 100 ± 7% (WT, surface), and 59 ± 9% (KO, surface) (n = 4 pairs; *p < 0.05). B, Cultured cortical neurons (DIV9) were transfected with mCherry-tagged scrambled shRNA (NC) or mCherry-tagged PICK1 shRNA (shRNA). Surface (biotin) EAAC1 and GluA2 were isolated by biotinylation and detected by antibodies to EAAC1, GluA2, PICK1, and β-actin (actin). B′, Percentage changes of surface signal intensities were 100 ± 2% (EAAC1, NC), 65 ± 3% (EAAC1, shRNA), 100 ± 4% (GluA2, NC), and 130 ± 6% (GluA2, shRNA) (n = 4; *p < 0.05). C, Cultured cortical neurons (DIV9) from WT and KO mice were treated with control lentivirus (NC) or lentivirus encoding PICK1 (OV). Surface (biotin) EAAC1 and GluA2 were isolated by biotinylation and detected by antibodies to EAAC1, GluA2, PICK1, and actin. C′, Percentage changes of surface signal intensities were as follows: EAAC1, 100 ± 3% (WT + NC), 126 ± 13% (WT + OV), 55 ± 9% (KO + NC), 101 ± 12% (KO + OV); GluA2, 100 ± 3% (WT + NC), 85 ± 5% (WT + OV), 126 ± 8% (KO + NC), 98 ± 5% (KO + OV) (n = 4; *p < 0.05, ANOVA test). D, Effects of overexpressing PICK1 on GSH content using maleimide staining in cultured cortical neurons from WT and KO mice. Neurons (DIV9) from WT and KO mice were treated with control lentivirus or lentivirus encoding PICK1. The maleimide signal was significantly lower in KO neurons than WT neurons, and expression of PICK1 significantly increased the signal intensity in KO neurons. Scale bars, 50 μm. Percentage changes of fluorescent intensities were as follows: 100 ± 4% (WT + NC), 104 ± 6% (WT + OV), 55 ± 3% (KO + NC), and 89 ± 5% (KO + OV) (n = 4; *p < 0.05, ANOVA test). E, WT, KO, and OV cultured neurons (DIV9) were used for performing cysteine uptake at room temperature for 30 s with l-[14C]cysteine concentrations of 0.1, 1, 5, 10, and 50 μm. The uptaken l-[14C]cysteine in harvested cell lysates (cpm/mg protein/s) with cysteine concentration of 10 and 50 μm were as follows: 10 μm, 657 ± 66 (WT), 286 ± 56 (KO), 574 ± 70 (OV); 50 μm, 860 ± 78 (WT), 397 ± 46 (KO), 785 ± 96 (OV) (n = 4; *p < 0.05 when KO was compared with WT or OV, ANOVA test).
