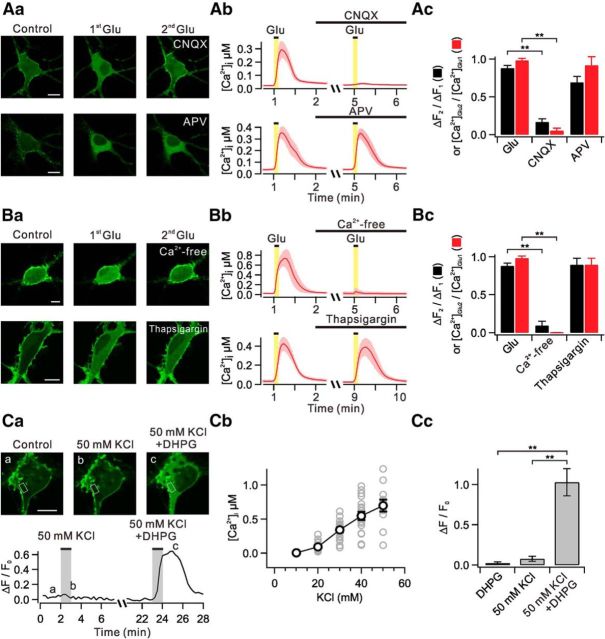
Figure 2.
Ca2+ influx triggered by AMPA receptor activation facilitates glutamate-induced PHδ-GFP translocation. Aa, Images demonstrate glutamate-induced translocation of PHδ-GFP in the presence of CNQX (AMPA receptor blocker) and APV (NMDA receptor blocker). Ab, Glutamate-induced [Ca2+]i in the presence of CNQX and APV. Error bars are shown in light colors. Ac, Bar graphs summarize mean ΔF2/ΔF1 (black) and [Ca2+]Glu2/[Ca2+]Glu1 (red). Ba, Images demonstrate glutamate-induced translocation of PHδ-GFP in Ca2+-free solutions or in the presence of thapsigargin (a sarco-endoplasmic reticulum Ca2+-ATPase blocker). Bb, Glutamate-induced [Ca2+]i in experimental conditions described in Ba. Bc, Bar graphs summarize mean ΔF2/ΔF1 (black) and [Ca2+]Glu2/[Ca2+]Glu1 (red). Ca, Images of PHδ-GFP translocation induced by 50 mm KCl only or 50 mm KCl plus DHPG (top) and time courses of ΔF/F0 measured in designated ROIs (bottom). Cb, Plot of [Ca2+]i versus different concentrations of KCl. Gray circles represent individual data. Cc, ΔF/F0 values are summarized in bar graph in experimental conditions described in Ca. **p < 0.01. Scale bar, 10 μm in all panels where indicated. Error bars represent SEM.

