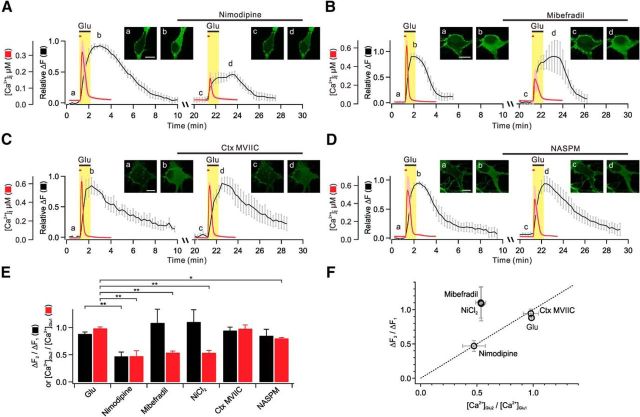
Figure 3.
L-type Ca2+ channels provide Ca2+ for glutamate-induced PHδ-GFP translocation. A–D, Averages of glutamate-induced [Ca2+]i (red) and relative ΔF (black) are plotted against time for two successive applications of glutamate (first applications are glutamate only, and second applications are glutamate plus L-type, T-type, or N/P/Q-type Ca2+ channel blockers, or Ca2+-permeable AMPA receptor blocker). The time intervals of first and second glutamate applications are actual values (20 min) for ΔF, but for [Ca2+]i measurements the time intervals were 4 min, as described in Figure 2Ab: they were superimposed for comparison of time-dependent events. The insets show representative images of PHδ-GFP translocation at indicated time points (a–d). Scale bar, 10 μm. E, Bar graphs summarize mean ΔF2/ΔF1 (black) and [Ca2+]Glu2/[Ca2+]Glu1 (red). F, ΔF2/ΔF1 values are plotted versus [Ca2+]Glu2/[Ca2+]Glu1 values. Dashed line indicates linear relationship. **p < 0.01; *p < 0.05. Error bars represent SEM.

