Figure 5.

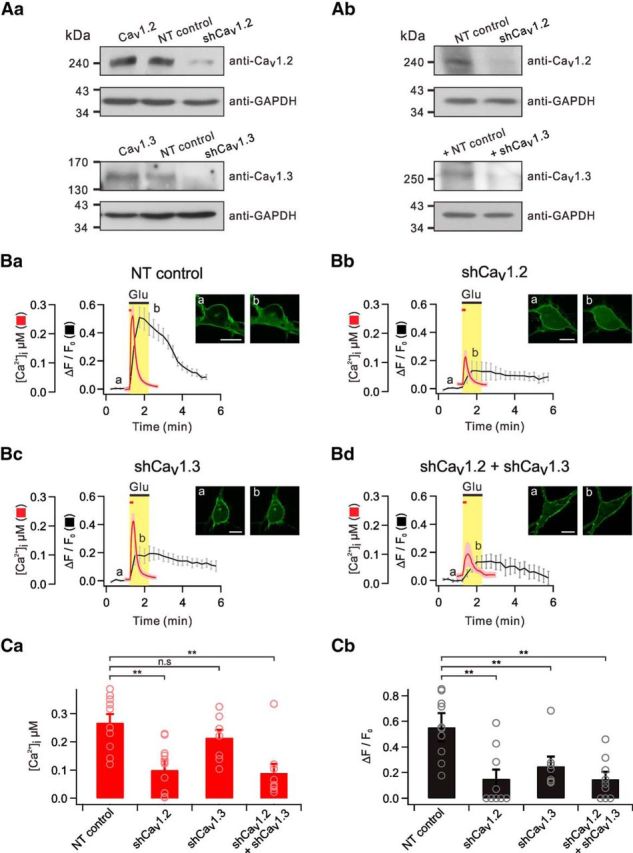
Both Cav1.2 and Cav1.3 contribute to glutamate-induced PHδ-GFP translocation. Aa, Western blotting of overexpressed Cav1.2 (top) and Cav1.3 (bottom) in HEK293 cells transfected with NT control, Cav1.2 shRNA (shCav1.2), or Cav1.3 shRNA (shCav1.3). Ab, Western blotting of endogenous Cav1.2 (top) and Cav1.3 (bottom) in primary cultured hippocampal neurons transfected with NT control, shCav1.2, or shCav1.3. GAPDH served as a loading control. Ba–Bc, Average of glutamate-induced [Ca2+]i and ΔF/F0 are plotted against time in cells transfected with NT control, shCav1.2, or shCav1.3. The insets show representative images of PHδ-GFP translocation at indicated time points (a, b). Scale bar, 10 μm. C, Bar graph summarizes [Ca2+]i (Ca) or ΔF/F0 (Cb) for each group. n.s p > 0.05; **p < 0.01. Error bars represent SEM.
