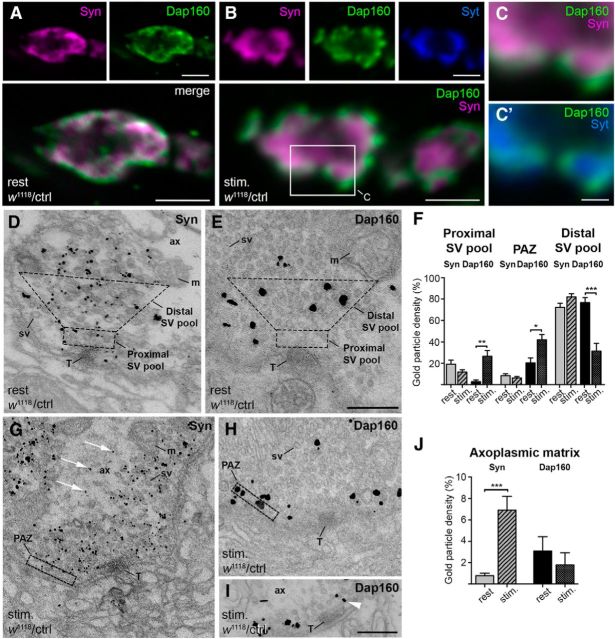
Figure 2.
Localization of synapsin (Syn) and Dap160 at NMJs at rest and during synaptic activity. A, B, Confocal images showing middle optical sections of control (w1118/ctrl) NMJs labeled with antibodies against Syn (magenta), Dap160 (green), and synaptotagmin (Syt, blue) at rest (A) and fixed following 10 min exposure to high K+ (B). Boxed area in B is shown enlarged in C and C′ to compare Syn labeling with Syt labeling. D, E, G–I, Electron micrographs of control terminals labeled for Syn and Dap160 using immunogold technique at rest (D, E) and during stimulation (G–I). Masks that outline the areas of the distal SV pool and the proximal SV pool in D and E, and the PAZ in G and H were used to quantify densities of gold particles in F. In stimulated synapses, Syn labeling appears in the axoplasmic matrix (G, white arrows) and Dap160 labeling is observed in the PAZ (H, I) and the proximal SV pool (I, arrowhead). F, Bar graph illustrating changes in Syn and Dap160 immunogold labeling in proximal and distal pools of SVs, and in PAZ in NMJs at rest and during stimulation. Bars represent mean + SEM; *p < 0.05; **p < 0.01; ***p < 0.001, Kruskal–Wallis with Dunn's post-test; n = 15–27 terminals from three animals in each group. J, Bar graph showing relative immunogold particle density in the axoplasmic matrix of NMJs labeled with Syn and Dap160 at rest and during stimulation. Bars represent mean ± SEM; ***p < 0.01, Mann–Whitney U test; n = 10. ax, Axoplasmic matrix; m, mitochondrion; sv, synaptic vesicle; T, T-bar. Scale bars: A, B, 2 μm; C, 0.5 μm; D, E, G–I, 0.2 μm.

