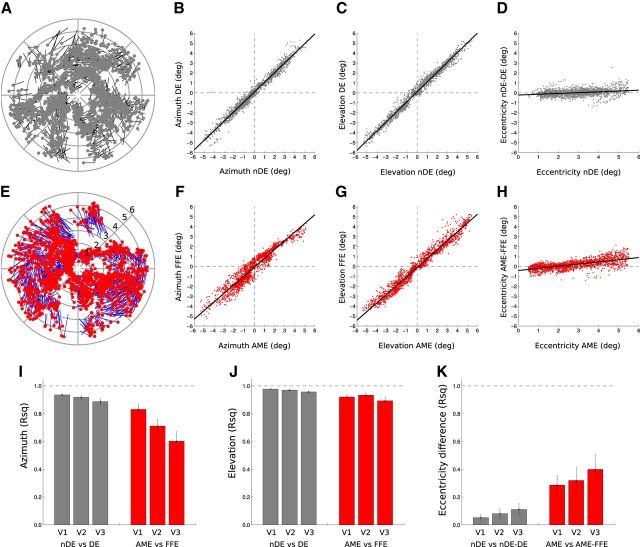
Figure 11.
Comparison of the distribution of the pRFs between the data for two eyes in V1, V2, and V3 voxels. The first two rows show the distribution of pRFs in the visual field, estimated from voxels in V1 of one normal subject (black and gray) and one amblyopic subject (A8, in blue and red). A, For each voxel (with a >30% variance explained for both eyes) the position of its pRFs in a polar plot of the normal participant. The black line represents the shift between the position from DE to nDE. The light gray dots represent the position of the pRFs of the nDE. B, The correlation between the azimuth coordinates between the two eyes. C, Correlation between the elevation coordinates. D, Relationship between the eccentricity of the pRFs of the nDE and the difference in eccentricity between the two eyes. A–D show how similar the pRFs positions are between the two eyes in normals. E, For each voxel (with a >30% variance explained for both eyes) the position of its pRFs in a polar plot of one amblyopic participant. The blue line represents the shift between the position from FFE to AME. The red dots represent the positions from the AME. F, The correlation between the azimuth coordinates between the two eyes. G, The correlation between the elevation coordinates. H, Relationship between the eccentricity of the pRFs of the AME and the difference in eccentricity between the two eyes. E–H, The pRF positions were highly correlated in amblyopic subjects. The corresponding correlation values were reported in I–K (respectively, azimuth, elevation coordinates, and eccentricity) for V1, V2, and V3. There was more variability in the azimuth position between the two eyes in the amblyopes, and that the variability increases along the visual pathway from V1 to V3. K shows that the pRFs tend to be more eccentric in AMEs and that this tendency increases with eccentricity but not with visual hierarchy.

