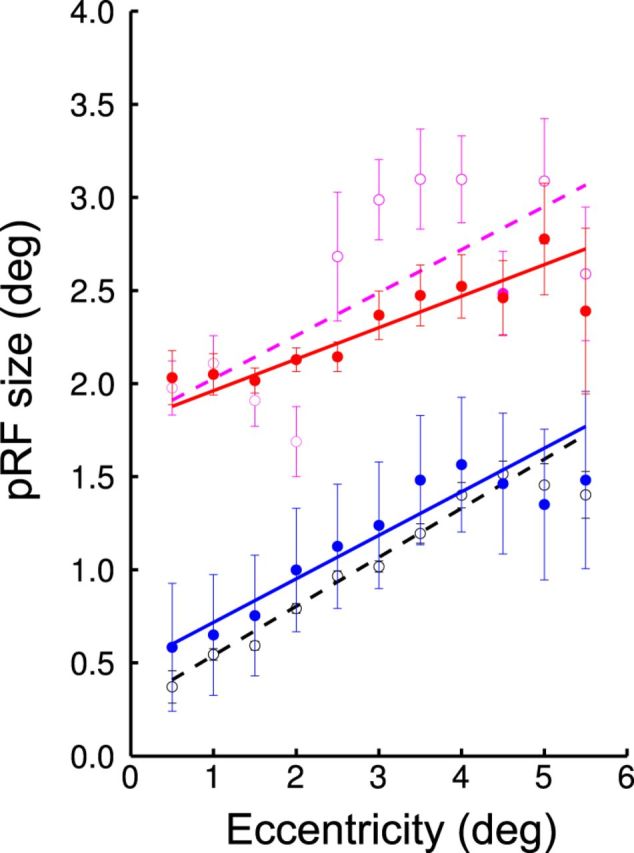
Figure 8.

Change of pRF sizes across eccentricity in V1 voxels of the amblyopic participant A4. The figure illustrates how the unsteady fixation of the AME can affect the estimation of pRF sizes. The effect on the AME data can be seen by comparing the purple and the red lines. The configuration is very similar to that of Figure 4A, but the data were combined every 0.5° of eccentricity. The dots and error bars represent the mean and SD of the binned data. The line is the best fitting regression line. The purple open dots and dotted line represent the data from the AME without correction for eye movements. The red closed dots and thick line represent the data from the AME after correction, which mainly produced an overall reduction of the error bars. The data from the FFE are shown in black and blue. The black open dots and dotted line represent the data from the FFE without correction for eye movements. The blue closed dots and thick line represent the data from the FFE after correction using not the FFE's movements but the AME's movements instead. The eye-movement deficit produces an overall increase of variability (increase size of error bars) and also an increase of the pRF sizes close to the fovea (as predicted by the simulation; Fig. 1, left). This increase is nonetheless not large enough to explain the difference of pRF sizes between the AME and the FFE.
