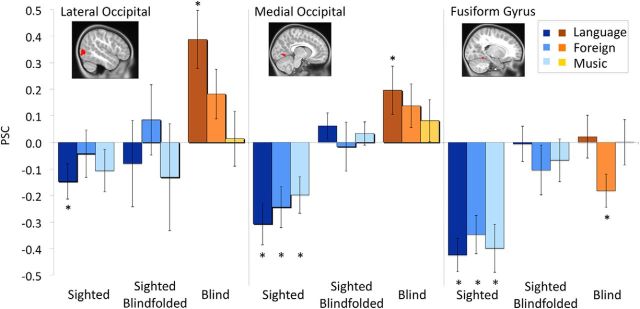
Figure 1.
Response of left occipital regions to language and non-linguistic sounds. Bars show PSC for language (darkest), foreign speech (intermediate), and music (lightest). Error bars represent the SEM. Asterisks indicate when a particular condition (bar) is different from the rest. Occipital regions show stronger responses to language and non-language sounds in blind children (right) than in sighted blindfolded children (middle) or sighted children without blindfolds (left).

