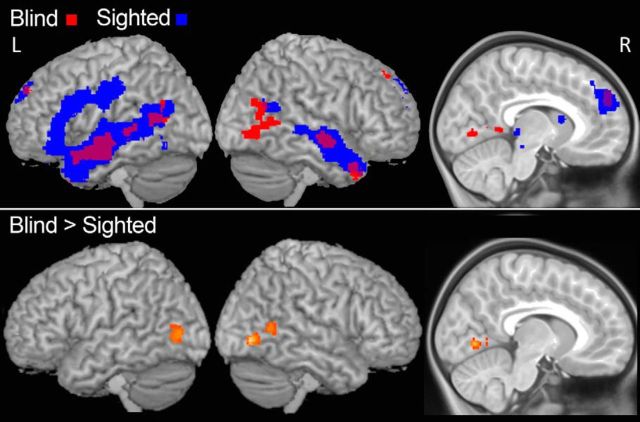
Figure 2.
Whole-brain responses to spoken language. Top, Whole-brain analysis of activity in Language > Music. Red, Blind children; blue, sighted children (with and without blindfold). Bottom, Whole-brain analysis of the group-by-condition interaction for Language > Music, Blind > Sighted (with and without blindfold; k = 50, p < 0.001 uncorrected).

