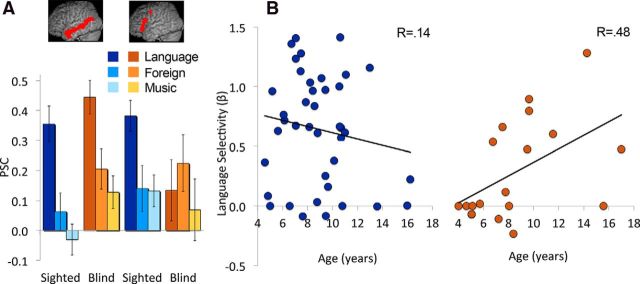
Figure 4.
Responses of frontal and temporal cortical areas to spoken language, foreign speech, and music. A, The bar graph shows PSC in temporal and prefrontal language areas. Temporal areas show similar language responses in blind and sighted children, whereas prefrontal regions show reduced selectivity in blind children. B, Scatter plots show relationship of age (x-axis) and prefrontal language selectivity (y-axis) for the sighted children (blue) and blind children (orange). A significant correlation is observed only in the blind group.

