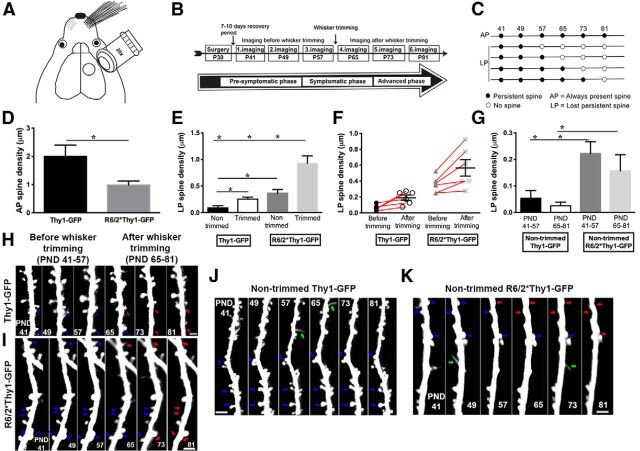
Figure 1.
Sensory deprivation exacerbates the loss of persistent-type mature spines in R6/2 mice compared with wild-type mice. A, Schematic of a cranial window on the somatosensory cortex where the imaging was performed. B, Timeline for imaging. C, Definition of spine categories: 41, 49, 57, 65, 73, and 81 represent imaging days. D, AP spine density, which is significantly lower in R6/2*Thy1-GFP mice compared with Thy1-GFP mice (wild types) during the 6 week imaging period. E, LP spine density in nontrimmed and trimmed Thy1-GFP and R6/2*Thy1-GFP mice. Trimmed mice lose more persistent spines compared with nontrimmed mice of both genotypes. F, Comparison of LP spine density before and after whisker trimming in trimmed Thy1-GFP and R6/2*Thy1-GFP mice. Before whisker trimming, Thy1-GFP mice do not lose any persistent spines; however, after whisker trimming, persistent spines are lost in the barrel cortical neurons of these mice. In contrast, R6/2*Thy1-GFP mice have already lost significantly more persistent spines, before whiskers are trimmed. After whisker trimming, persistent spine loss is exacerbated in R6/2*Thy1-GFP mice. G, LP spine density in an independent group of age-matched nontrimmed Thy1-GFP and R6/2*Thy1-GFP mice during P41–P57 and P65–P81. No difference in dendritic spine density is observed between P41 and P57, and between P65 and P81. H, Time-lapse image of a dendritic branch from Thy1-GFP mouse showing the loss of two persistent spines after whisker trimming (red arrows). I, Time-lapse image of a dendritic branch from R6/2*Thy1-GFP mouse indicating the loss of five persistent spines after whisker trimming (see red arrows on P81). J, K, Time-lapse image of a dendritic branch from an independent group of nontrimmed Thy1-GFP mice (J) and nontrimmed R6/2*Thy1-GFP mice (K) that loses significantly more persistent spines (red arrows) compared with Thy1-GFP mice, regardless of age. Representative dendrites (time-lapse images) are from layer II/III of the cortex. Blue arrows indicate persistent spines, while green arrows indicate new spines. Asterisks indicate significant differences between groups. Data are presented as the mean ± SEM. Means were considered to be statistically significant if p < 0.05. N = 6 mice/group. Scale bars, 2 μm.

