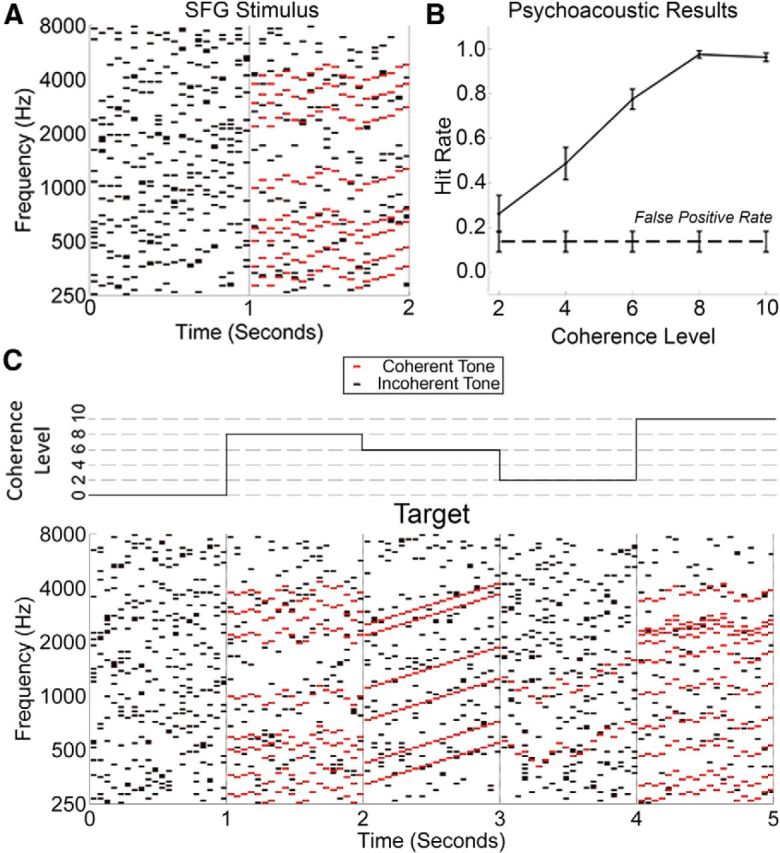
Figure 1.

Examples of SFG stimuli and the psychoacoustic results. A, The spectrogram of an example of an SFG stimulus used in our experiment. Each black/red dot represents a pure tone lasting for 50 ms. A chord is defined as the summation of multiple tones. Here, each chord contains exactly 15 tones, which are not harmonically related. There is no overlap between neighboring chords, resulting in 20 inharmonic chords every second. From 0 to 1 s, there is no temporal coherence between the various tones from chord to chord. However, from 1 to 2 s, a noticeable pattern emerges whereby eight groups of tones (in this example) change frequency from chord to chord in a coordinated fashion (red). These changes in frequency are random, but are limited to ≤2 semitones per chord. This coordinated movement (temporal coherence) between groups of tones can result in the spontaneous percept of a figure popping out of a random background of varying tones. B, Results from the psychoacoustic experiment in which subjects were given a figure-detection task. The false-positive rate was calculated as the number of times that subjects reported detecting a figure when no figure was present. Error bars represent SEM. C, An example of 5 s of a stimulus used for the EEG experiment. The coherence level changes every second, as illustrated by the step function above the spectrogram. In this example, a “target” occurs from 2 to 3 s, and consists of a ramped figure in which all coherent tones move upwards continuously for the duration of the figure.
