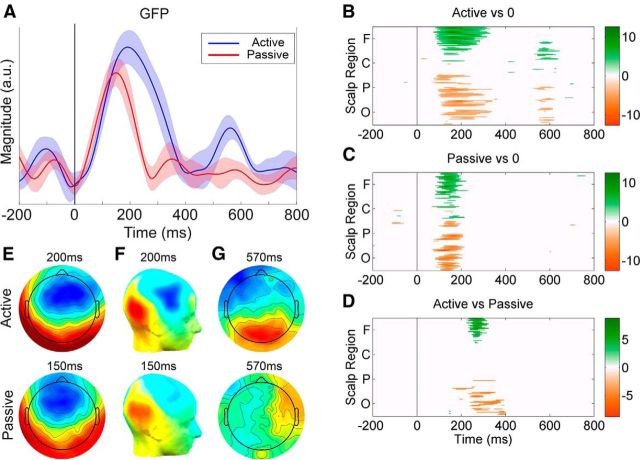
Figure 2.
Results of the TRF analysis. A, GFP plots of the grand-average TRFs for the active (blue) and passive (red) conditions. The solid black line indicates zero time lag between EEG and stimulus. The shaded areas indicate SEM. B, C, Statistical cluster plots marking the time points for all electrodes at which the TRF response differed significantly from zero on the basis of two-tailed t tests, with multiple comparisons corrected for via FDR (q = 0.05). White denotes nonsignificance, whereas positive t values (TRF > 0) are marked on a green scale and negative t values (TRF < 0) are marked in gold. Electrodes are ordered from the bottom: occipital (O), parietal (P), central (C), and frontal (F) proceeding in the anterior direction in rows from left to right. D, The time points at which the active response differed significantly from the passive response (2-tailed paired t test, FDR corrected, q < 0.05). E, F, Scalp voltage topographies (E) and CSD topographies (F) of the TRFs for the Active (t = 200 ms) and Passive (t = 150 ms) conditions. G, Scalp voltage topographies of the TRFs for the Active and Passive conditions at 570 ms. All topographies are displayed on the same scale.

