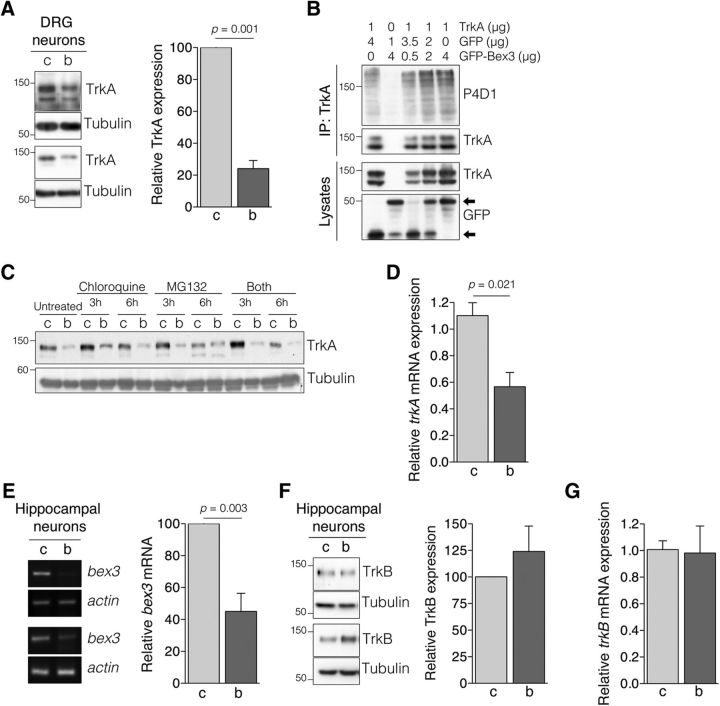
Figure 4.
Bex3 levels regulates TrkA, but not TrkB, protein levels through modulation of trkA mRNA. A, TrkA protein levels are reduced in DRG neurons upon Bex3 downregulation. Cultured DRG neurons were infected as described in Figure 3A, and cell extracts were obtained to analyze TrkA expression by Western blot. Tubulin was used as a loading control. Two representative Western blots are shown (left). Quantification of TrkA levels in response to Bex3 downregulation (right). Western blots were scanned and quantified using ImageJ software. Data were normalized to the amount of tubulin and are presented as the mean ± SEM (100% vs 24.1 ± 5.1%, control vs Bex3 shRNA, respectively; n = 7). The p value was calculated using a two-tailed Student's t test. B, GFP-Bex3 expression does not affect TrkA ubiquitination. HEK293 cells were transfected with TrkA and different amounts of GFP-Bex3. TrkA was immunoprecipitated 24 h after transfection, and TrkA ubiquitination levels were assessed by Western blot. A representative experiment is shown (n = 3). Arrows indicate GFP or GFP-Bex3. C, Bex3 levels do not alter TrkA degradation. Cultured DRG neurons were infected at DIV5 with control shRNA (C) or Bex3 shRNA (B) lentivirus for 5 d, and then treated with chloroquine (10 μm), MG132 (50 μm), or both for 0, 3, or 6 h. Western blot analyses were performed to detect TrkA levels. A representative experiment is shown (n = 3). D, Bex3 downregulation decreases trkA mRNA levels. Cultured DRG neurons were infected as described in Figure 3A. RNA was obtained with TRIzol reagent, cDNA was synthesized, and quantitative PCR was performed as described in Materials and Methods. The relative transcription level of trkA was normalized to that of actin using the 2-ΔΔCt method. Data are presented as the mean ± SEM (1.10 ± 0.1 vs 0.57 ± 0.1, control vs Bex3 shRNA, respectively). Triplicate determinations from three independent experiments were quantified. The p value was calculated using a two-tailed Student's t test. E, bex3 mRNA downregulation in hippocampal neurons infected with lentivirus-expressing rat Bex3 shRNA. Experiments using cultured hippocampal neurons were performed and quantified in a similar way as described in Figure 3A. Data are presented as the mean ± SEM (100% vs 45.0 ± 11.4%, control and Bex3 shRNA, respectively; n = 4). The p value was calculated using a two-tailed Student's t test. F, TrkB protein levels are not altered upon Bex3 downregulation. Extracts from hippocampal neurons infected with control shRNA (c) or Bex3 shRNA (b) lentivirus were analyzed for TrkB expression. Tubulin was used as a loading control. Two representative Western blots are shown (left). TrkB levels (right) were quantified, as described in A. Data are shown as the mean ± SEM (100% vs 124.0 ± 23.9%, control and Bex3 shRNA, respectively; n = 4). The p value was calculated using a two-tailed Student's t test. G, Downregulation of Bex3 does not affect trkB mRNA. RNA was obtained from infected hippocampal neurons, and qPCR was performed as described in D. Data are shown as the mean ± SEM (1.0 ± 0.06 vs 0.98 ± 0.20, control and Bex3 shRNA, respectively). Triplicate determinations from three independent experiments were quantified.

