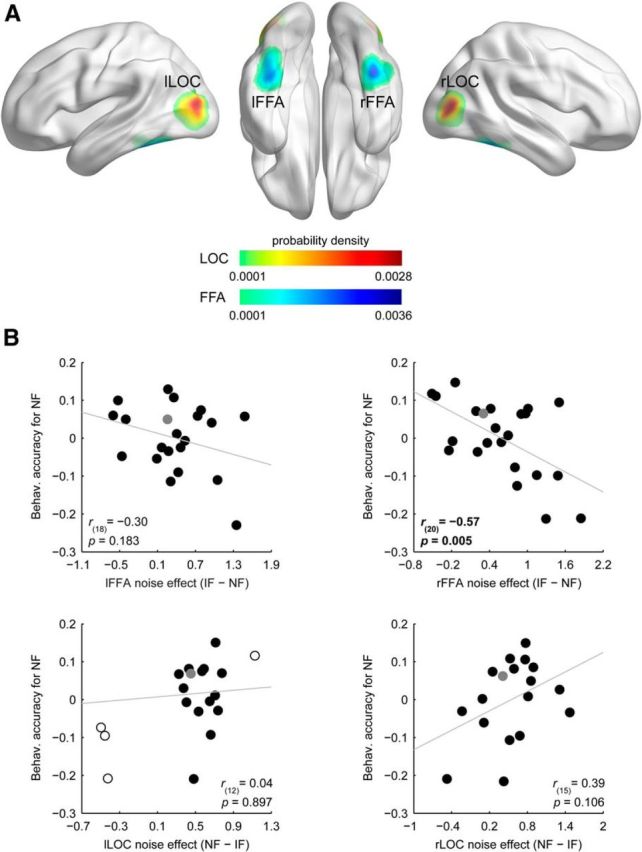
Figure 3.

Results of the ROI-based correlation analysis. A, Probability density map illustrating the spatial distribution of the highest noise-effect voxels across participants in bilateral FFA and LOC. Color scales reflect probability density estimates (cool colors, FFA; warm colors, LOC). B, Relationship between the noise-induced modulation of the fMRI responses and the behavioral accuracy in discriminating noisy faces: smaller decrease of the fMRI responses in the right FFA indicated better identity discrimination. Due to the semipartial correlation procedure (see Materials and Methods, Correlation analysis), correlation scatter plots depict residual values on the y-axis. The y-axis values denote behavioral accuracy for noisy faces indexed by the residual correct response ratio. The x-axis values denote noise effect on the fMRI responses indexed by the β-difference in the IF versus NF contrast. Circles represent individual participants and bivariate outliers are marked with open circles, while the data point for the left-handed subject is depicted in gray. Diagonal line indicates linear least-squares fit.
