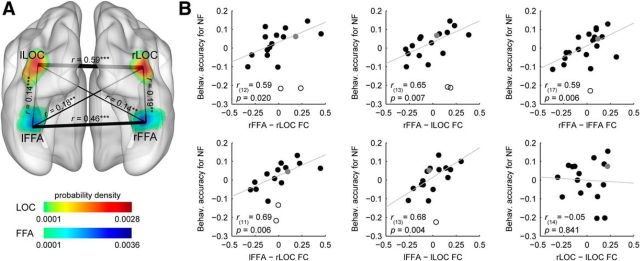
Figure 4.
Results of the intrinsic functional connectivity analysis. A, Connections between the pairs of ROIs displayed as edges and overlaid on the probability density map from Figure 3A. The thickness of an edge represents the strength of the connection [correlation coefficients (r) averaged across subjects]; significant correlations were found between all ROI pairs investigated. B, Scatter plots indicating the relationship between the intrinsic functional connectivity and the behavioral accuracy for noisy faces. The strength of the functional connectivity between bilateral FFA and LOC, as well as between the right and left FFA, correlated positively with the identity-discrimination performance in the case of noisy faces. Due to the partial correlation procedure (see Materials and Methods, Correlation analysis), correlation scatter plots depict residual values on both axes. The y-axis values denote the behavioral accuracy for noisy faces indexed by the residual correct response ratio. The x-axis values denote the connection strength between a ROI pair indexed by the residual correlation coefficient. Circles represent individual participants. Bivariate outliers are marked with open circles, while the data point for the left-handed subject is depicted in gray. Diagonal line indicates linear least-squares fit. FC, functional connectivity (**p < 0.01, ***p < 0.001).

