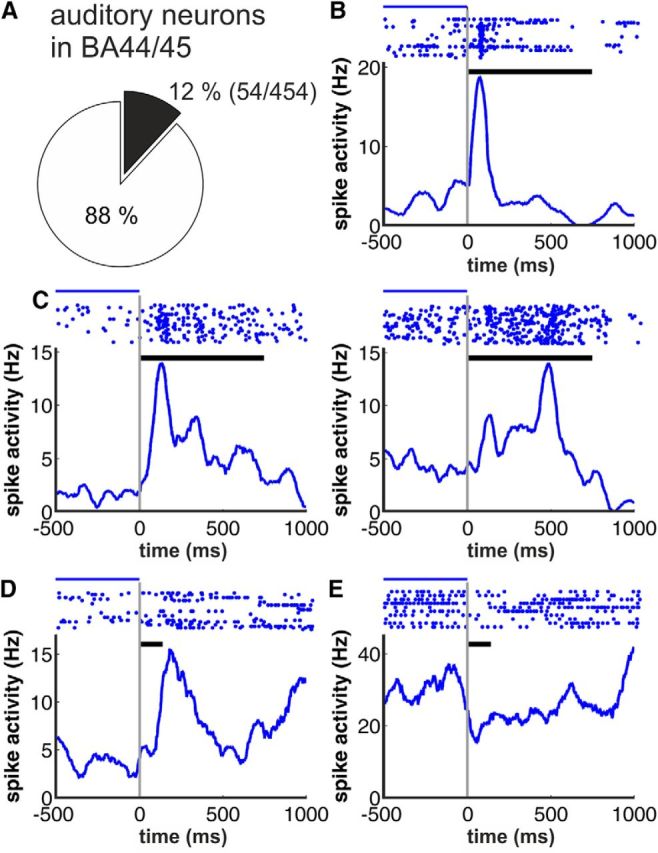
Figure 3.

Examples for acoustic responses. A, Proportion of neurons showing auditory responses in BA44/45 (54 of 454 recorded neurons). B–E, Example neurons showing different types of activity in response to coo (monkey T) and grunt vocalization (monkey C). Top, Neuronal responses are plotted as dot-raster histograms (each dot represents an action potential). Bottom, Spike-density functions (activity averaged over all trials and smoothed by a 100 ms Gaussian kernel). Phasic (B), sustained (C), and long-latency responses (D) and suppressed activity after call onset (E) were observed. Example neurons in B and C were recorded in monkey T, whereas neurons depicted in D and E stem from monkey C, respectively; black horizontal bars between dot-raster histograms indicate the duration of the coo and grunt vocalization used as acoustical stimulus for monkey T and C, respectively. Blue lines indicate from where the baseline firing rate was estimated.
