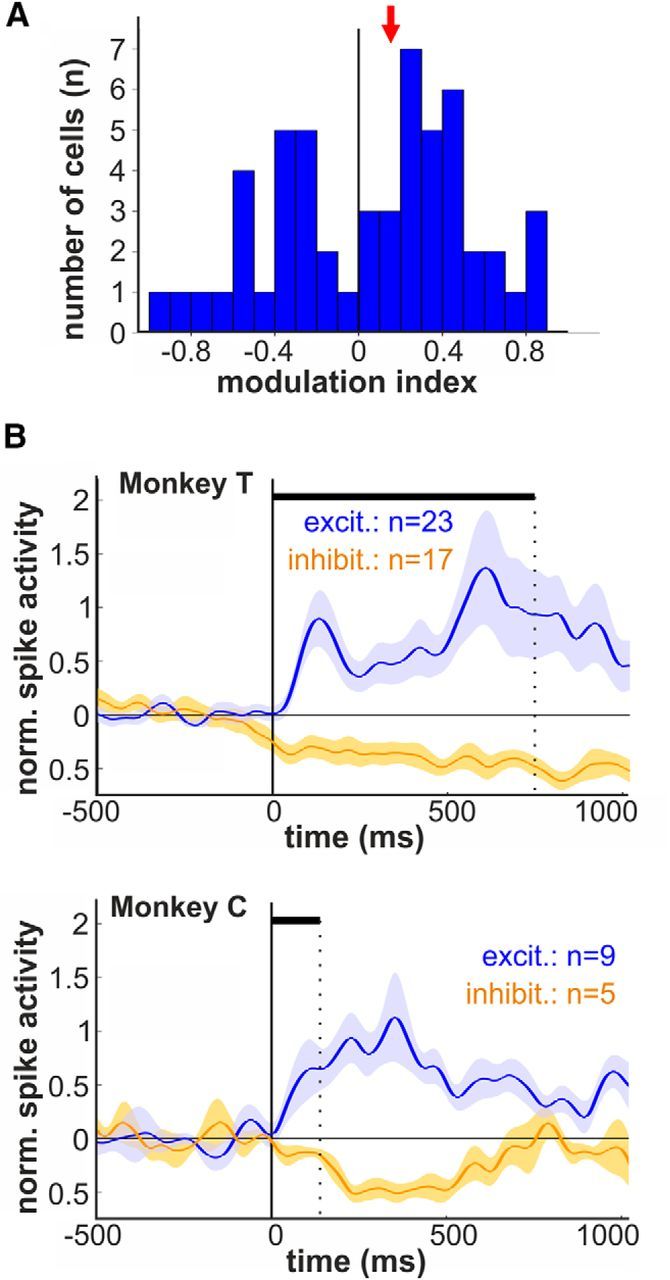
Figure 4.

Modulation indices and population responses for excited and inhibited auditory activity. A, Distribution of the modulation indices indicating the magnitude of excitation and suppression during auditory stimulation (red arrow, median modulation index). B, Average normalized activity (population responses) for auditory neurons showing increased and suppressed responses separately for monkey T and C, respectively.
